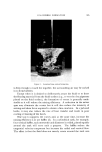
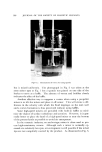
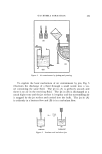
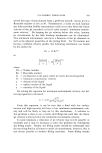
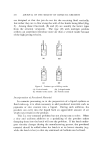
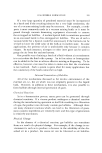
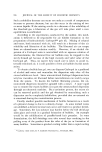
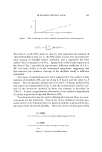
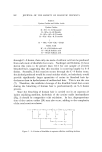
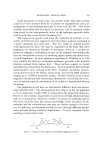
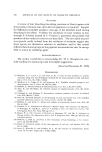
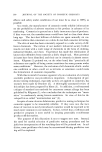
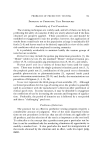
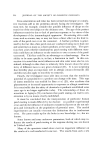
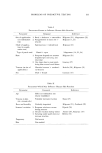
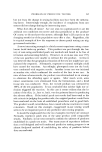
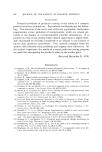
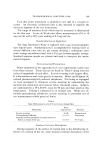
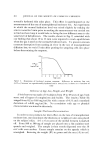
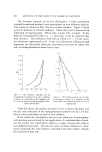
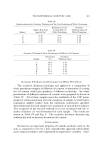
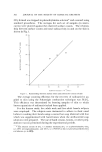
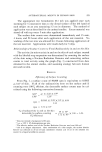
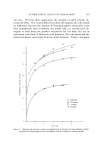
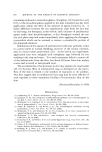
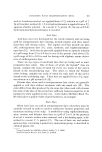
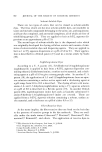
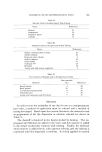
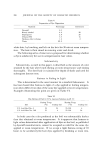
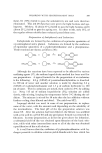
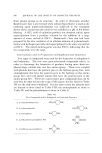
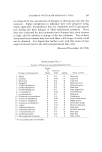
366 JOURNAL OF THE SOCIETY OF COSMETIC CHEMISTS The fractions reduced (n) for five thicknesses of white petrolatum (normally marketed product) were determined on four different subjects. The results are shown in Fig. 3 for two of these subjects. Figure 3 shows a plot of thickness vs. fraction reduced. These data can be linearized by replotting on log-log paper. When this is done, Fig. 4 results. If the lines are extrapolated to the 1In z 1 intercept, it can be observed that they intersect. The thickness of the fil•n at which 1/n = 1 is the occlu- sive thickness, represented as (S). It has as its dimension millimeters and represents the theoretical thickness of products necessary to reduce the rate of transepidermal moisture loss to zero. C.5 0.35 o .30 o .2• o .Io • o.•0 (mm) O d o.15 o. 0õ 0.05 o 0•_ o 6[0 I 0 I 0 910 50 7 8 100 001 n 10 Figure 3. The fraction reduction (•) transepidermal moisture loss for 2 subjects is sho•n as a fimction of the thickness (d) of a layer o[ •hite petro]atum applied to the surface of the skin o 1.5 i i I i ] •o •5 1/rl Figure 4. The thickness (d) in mm of white petrolatum is shown as a function of the rccil)rocal of the fraction reduced (l/n) on a log-log scale Table III shows the results obtained for the occlusive thickness and the per cent reduction of the transepidermal moisture loss by a O.l-mm film of white petrolatum on each of four subjects. If the results are calculated as the per cent reduction of transepider- mal moisture loss achieved by the application of a uniform film of prod- uct, the results vary widely from subject to subject because the subjects have different base rates. By contrast, when occlusive thickness is calcu- lated, essentially the same result is obtained from each subject, despite the variation in base rate.

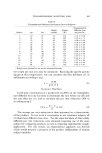
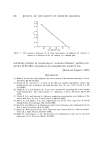
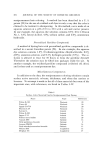
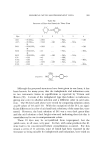
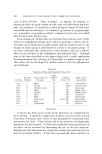
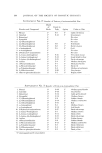
TRANSEPIDERMAL MOISTURE LOSS 367 Table III Results obtained for Occlusive Thickness and Per Cent Reduction of White Petrolatum Reduction (%) by Occlusive Subject Base Rate 0.1-mm Film of Thickness (mm) of Subject (mg/cm2/hr) White Petrolatum White Petrolatum A 0.39 77.5 0.38 B 0.24 90.2 0.38 C 0.32 83.0 0.40 D 0.19 93.0 0.39 Table IV Occlusive Thickness of 5•hite Petrolatums of Different Oil Contents Oil Content Occlusive Sample (%) Thickness (mm) A 52.8 2.31 B 57.O 1.35 C 61.7 0.74 D 66.1 0.39 E 70.4 0.22 F 74.6 0.13 Occlusive Thickness and Oil Content of White Petro[atum The occlusive thickness technique was applied to a comparison of white petrolatum samples of different oil content to determine if varying the oil content would give products of different occlusivity. Six white petrolatums of different mineral oil content were prepared as shown in Table IV. All of these samples meet the standards of the USP mono- graph for white petrolatum with the exception of sample A which had a consistency slightly harder than the minimum penetration specified. Four thicknesses for each sample were examined on each of three subjects. The reciprocal of the fraction reduced (l/n) was calculated and the oc- clusive thickness (S) was determined for each sample. The results are shown in Table IV and Fig. 5. The occlusive thickness decreases log- arithmically with an increase in mineral oil content. CONCLUSIONS Occlusivity, an important property of cosmetic products used on the skin, is evaluated in vivo by a new, reproducible approach which elimi- nates subject-to-subject and experiment-to-experiment variables. Char-
Purchased for the exclusive use of nofirst nolast (unknown)
From: SCC Media Library & Resource Center (library.scconline.org)