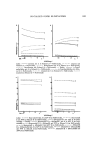
266 JOURNAL OF THE SOCIETY OF COSMETIC CHEMISTS (b) Compute the difference between the antiperspirant and control means (in terms of logs) Tx ---- 5.6656: T2 '- 6.2820 D •- 5.6656 - 6.2820 = --0.6164 note that the difference used is antiperspirant minus control, not the re- verse. (c) Compute the 95% confidence interval about the population difference CL0.95 =• +- S• t0.0.• where i5 represents the above difference S• represents the standard error of the difference and t0.05 represents Student's t at ot = 0.05. In the example __ D = -0.6164 S•= 0.0504 t.05 = 2.228* so that or CL0.9, = -0.6164 -+ (0.0594)(2.228) = -0.6164 - (0.1323) -0.4841 to -0.7487 (d) A difference between the logarithms of two numbers is the ratio of the two numbers when antilogs are taken. Thus antilog • - • T2 __ __ where T• and T,are in milligrams. If we take antilogs of the two confi- dence limits, we obtain a maximum and minimum ratio of antiperspirant to control milligrams, representing 95% confidence limits about the popula- tion mean ratio: antilog -0.4841 = 0.6163 antilog -0.7487 = 0.4730 PR• = (1-0.6163) 100 = 38.37 PR (from step 3) = 46.01 PR2 = (1-0.4730) 100 = 52.70 *At 10 df (the error df in fl•e ANOVA).

ANTIPERSPIRANT EVALUATION PROCEDURES 267 B. RM Calculations (Without Transformations) The method to be illustrated manipulates individual adiusted ratios and is commonly used. Another, not illustrated here, uses individual per cent reduc- tion values computed from single adiusted ratios as the basic statistics. Both methods are incorrect due to the fact that they use statistics (arithmetic means, estimates of standard deviations, and standard errors), which yield biased results because of the nonnormal character of the ratios and per cent reduction values. An additional source of bias in the error estimates is lack of provision for the influence of residual sides effects, since it is unlikely, as dis- cussed above, that the adiustment procedure removes them completely. Pro- cedure B is illustrated, therefore, solely to show the departure from the correct values given by method A. For simplicity, in our examples of the RM we use mean pretest ratios derived from two successive days of pad B runs, and a single hot-room test using pad B only is illustrated. This procedure is commonly done as follows: 1. Individual pretest and posttest ratios are computed from the milligram data. For the data of the example, these were given in Table I. 2. Arithmetic means of the pretest ratios are calculated, and the adjusted ratios are computed by dividing the posttest ratios by these mean pretest ratios. For example, for subject 19 in Table I (chosen because of the fairly large disagreement between the two pretest ratios) Pretest ratio, day I = Rv• = 0.421 Pretest ratio, day 2 = Rv.2 = 0.763 Mean pretest ratio = Rv = 0.592 Posttest ratio = P•t = 0.429 -- Adiusted ratio = R' = Rt/R v = 0.725 --, In a similar way, R' values for each of the 12 subjects of Table I are com- puted. These are shown in Table IV (last column). -- The overall mean posttest ratio R' is obtained by averaging the adjusted ratios R' in Table IV (R'= 0.6173). The variance, standard deviation, and standard error of the mean are com- puted from the adjusted ratios R' Estimated variance = S 2 = 0.0235 Estimated standard deviation = Sxi = 0.1533 Estimated standard error = S• = 0.0442 95% confidence limits about R -7 are computed using S• and Student's t at p = 0.05 and 11 degrees of freedom __ -- CL9• = R' +-- Sx to.oh = 0.6173 +-- (0.0442) (2.201) = 0.7146 to 0.5200
Purchased for the exclusive use of nofirst nolast (unknown)
From: SCC Media Library & Resource Center (library.scconline.org)