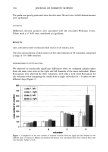
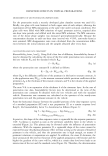
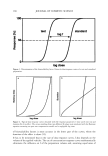
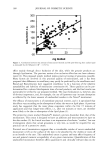
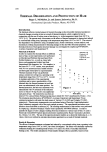
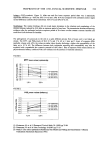
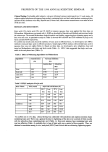
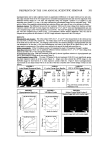
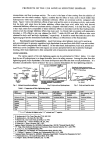
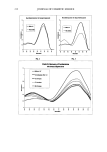
170 JOURNAL OF COSMETIC SCIENCE estimation of the relative bioavailability as a result of an insufficient parallelism of the dose-response curves resp. a reduction in the penetration rate. If an enhancement effect is mainly caused by an increase of the permeant diffusion coefficient in the stratum comeurn, it has to be considered that the lag time, which depends not only on the thickness of the barrier but also on the permeant diffusion coefficient in the barrier (15), may also influence the shape of the dose-, concentration-, or activity-response curves, particularly those obtained with the response parameter 1/LT: the resulting curves do not run parallel to each other and different plateau values may be reached. In this case a correct estimation of the bioavailability factor from the distance of the curves is impossible. However, it has been found that pronounced penetration enhancement is mainly caused by an increase of the permeant solubility in the barrier csn rather than by an increase of the permeant diffusion coefficient Dn (16). Depletion factor DF. Any increase of R leads to a more or less pronounced permeant depletion. This phenomenon is not described by the above-mentioned equations. With the data of both in vivo studies, permeant depletion, which usually occurs under finite- dose conditions and which manifests itself in a significant decrease of the permeant penetration rate and thus in an insufficient parallelism of the dose-, concentration-, or activity-response curves, can be quantified. In order to do so, a so-called depletion factor DF is introduced and can be calculated from the infinite-dose (inf) and finite-dose (fin) enhancement factors EF as follows: DF = EFinf/EFoein (Eq. 5) Depending on which vehicle is chosen as standard, these depletion factors can reach values greater or smaller than unity. A standard vehicle that shows pronounced pen- etration-enhancing properties leads to values • 1, whereas an inert standard vehicle leads to values • 1. It again has to be mentioned that not only Dn and csn as described by the enhancement factor but every single factor included in R contributes to the extent of permeant depletion. RESULTS AND DISCUSSION The bioavailability factors fh resulting from the in vivo studies are shown in Figure 3. As the extent of permeant input can be assumed to be 100% with all three methods, any differences in fh are attributable to differences in the rate of permeant input. In absence of penetration enhancement and depletion effects, all data points should be located on the theoretical straight line described by the equation fh = •/T/S•:' Deviations from the straight line may be interpreted as follows: higher values as in the case of IPM result from penetration enhancement, whereas lower values indicate MN depletion of the preparations, which is particularly obvious in the case of the response parameter duration of the erythema. Permeant depletion manifests itself in an insufficient parallelism of the concentration-response curves, which may lead to an underestimation of fh if the stan- dard vehicle is inert with regard to penetration enhancement and shows the highest MN solubility as compared to the test vehicles. As in the case of the time of onset, the duration of the effect, i.e., the time period during which the MN concentration at the receptor site is above the threshold concentration required for an effect to become obvious, depends on the permeant penetration rate and thus on R and the applied permeant dose. If the penetration rate decreases rapidly over time as in the case of high

DEPLETION EFFECTS IN TOPICAL PREPARATIONS 171 11 10. 9. 8. 7. 6. Latency time n=10 Penetration measurement n=12 ...."" DIM ... ..' ... ..' ... ... .. Duration n--11 4: IPM ...'" DIM ß ... .. .•.." CCT .: 0 T' T' T'""'"'"'"' ...... T'" ...... 0 5 6 7 8 90 I 6 90 6 9 ¾T/ST Figure 3. Bioavailability factors fh as a function of the relative effective activity coefficient •/T/s-r. The dotted line represents the function fh -- YT/s•r - Error bars are 95% confidence intervals. R values, this time period, i.e., the duration of the effect, is reduced. As mentioned earlier, the most accurate bioavailability factors may be determined from the low-dose range of the curves where the duration of the effect is rather short (Figure 2b). However, even in the low-dose range of the curves, the theoretical f values will never be reached, leading to the conclusion that the duration of the effect is an unsuitable parameter of response. The response parameter 1/LT is only marginally influenced by decreased penetration rates because the onset of the erythema occurs within minutes after appli- cation of the ointment. Thus, permeant depletion will only become obvious if the permeant penetration rate is markedly reduced. High penetration rate constants may lead to an underestimation of the response values in the low response region of the concentration-response curves, which is the reason for the deviation of the fh values from the theoretical or the infinite-dose values as shown with DIM (Figure 3). With increas- ing permeant concentration in the vehicle and thus decreasing latency time, this devia- tion becomes less evident and even disappears at high permeant concentrations (Figure 2a). Theoretical or infinite-dose values can only be obtained from the upper parts of the curves right below the plateau where parallelism is given (12). Generally, the higher the horizontal distance between the dose-response curves of a test and a standard preparation, i.e., the higher the RT/RsT ratio, the more pronounced permeant depletion will become, which manifests itself in underestimated bioavailabil- ity factors. It is therefore preferable to determine the horizontal distances between dose-response curves instead of concentration- or activity-response curves in order to get a better impression of the extent of permeant depletion. The greater bioavailability factors resulting from the infinite-dose penetration rate data are not only a result of the minimized permeant depletion but are also due to penetration enhancement in the case of IPM and MO. From concentration-response curves, no specific vehicle effects can be detected with MO because of an interference of penetration enhancement with permeant depletion (Figure 3). For this reason, no penetration- enhancing effect could be found with MO in a recent study (9).
Purchased for the exclusive use of nofirst nolast (unknown)
From: SCC Media Library & Resource Center (library.scconline.org)