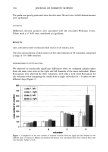
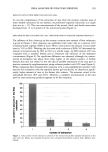
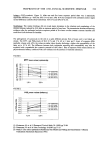
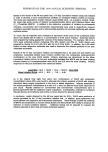
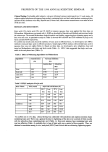
PREPRINTS OF THE 1998 ANNUAL SCIENTIFIC SEMINAR 195 Based on the results of the 48 hour patch test, a 14 day cumulative irritation study was initiated in order to develop a more comprehensive portfolio on surfactant irritation profiles in humans. The study was expanded to include: Sodium Lauryl Sulfate (SLS - as a positive control), SLES, the newer high pudty version of Sodium Cocoamphoacetate (SCA) and Potassium Mono Alkyl (C•2) Phosphate (MAPS). In addition to the subjective evaluation of irritation by professional clinicians, Corneometer and Chromameter measurements were used to respectively measure surfactant associated dryness and to instrumentally quantify and correlate reddening with clinical erythema scores. To insure that all materials were evaluated at equivalent levels each of the surfactants listed above was diluted with DI water to a concentration of 0.5% active material. Surfactant blends were prepared by mixing appropriate volumes of the diluted materials. For example, 100 ml of a 0.5% (w/w) surfactant solution containing 75% SCA dilution and 25% of SLES dilution was prepared by mixing 75 ml of 0.5% SCA with 25 ml of 0.5% SLES. In addition, the 0.5% stock dilution of each respective surfactant was used to determine the irritation potential of the pure unblended surfactants. Results of the 14 day cumulative irritation test indicated that in all cases the pure MAPS and Amphoteric surfactants elicited lower irritation profiles than the comparable surfactant/SLES combinations or the pure SLES sample. Irritancy responses (as determined by the Mean Cumulative Irritation Score) for the pure surfactants indicated that MAPS was the least irritating followed closely by Cocoamphoacetate while SLES and SLS were the most irritating. Irritancy responses for the pure surfactants were ranked as follows: Least Mild-SLS SLES SCA MAPS--Most Mild Mean Irritation Score-40.3 I 30.9 I 11.8 I 4.48 As in the original forty eight hour patch test, combinations of SLES with amphoteric concentrations above 25% were found to attenuate the irdtancy potential of SLES with irritancy reductions being roughly proportional to the level of added amphotedc. Irritancy potentials of the anionic:amphotedc combinations at a ratio of 3:1, were not different from those observed for pure SLES. Results obtained for Corneometer and Chromameter measurements were in general agreement with the subjective expert evaluations. Consequently, rankings for surfactant induced dryness and erythema were similar to those obtained for general irritation. In conclusion, results obtained by the 48 hour patch test for SCA / SLES were predictive of results generated by the 14 day cumulative irritation test. In addition, good agreement was found between the subjective and instrumental techniques. These findings confirm the mildness of MAPS and amphotedcs in human clinical studies and demonstrate their ability to enhance the mildness of mixed surfactant systems. Additional testing will be required to evaluate the irritation potential of other neat and mixed surfactant systems.

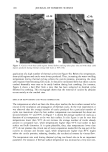
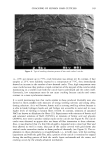
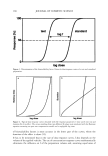
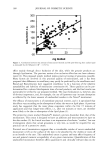
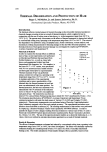
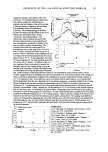
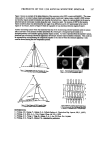
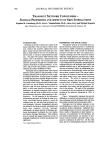
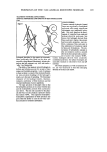
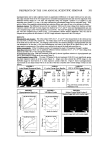
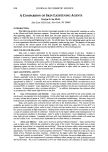
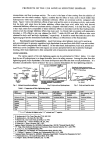
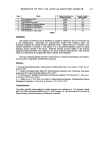
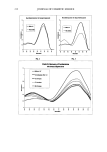
196 JOURNAL OF COSMETIC SCIENCE SURFACTANT ASSOCIATION STRUCTURES AND PHASE CHANGES DURING EVAPORATION OF COSMETIC EMULSIONS •P. Aikens, 2S.E. Friberg, 2T. Huang, 2y. Yang, 2H. Yang •ICI Surfactants, Wilmington, DE 19850 2Dept. of Chemistry, Clarkson University, Potsdam, NY 13699 INTRODUCTION: The changes which occur due to evaporation in a cosmetic emulsion after application to the skin can have a signill- cant impact on the performance and efficacy of the product. In a straightforward water/non-volifile oil/surfactant system, the evaporation of water increases the relative concentrations of oil and surfactant, causing surfactant association structures such as hexagonal or lamellar liquid crystalline phases to appear. The path taken follows a straight line from the 100% water comer of the ternary phase diagram through the formulation point (Figure 1)' ff the oil has a high vapor pressure. ff the oil is volatile, a more complex curved path from the water corner results. Figure 2 shows the exact phase changes in the W/O emulsion at various points marked along the evaporation path. Implications from a skin-care point of view are that the formulation could pass through or end up in a 1,2 or 3-phase region during the evaporation process, depending on initial composition and also that chemical potential of actives can be controlled 2. The phase behavior of water, vegetable oil, nonionic surfactant and the sunscreen active octyl dimethyl p-amino benzoic acid (ODP) 3 is examined as well as that of the humectant polymer sodium hyaluronate in water and surfactant 4. EXPERIMENTAL METHODS: Phase Diagrams: Maximum solubility boundaries were determined visually at•er titration with oil or water. Liquid crystalline phases were identified and differentiated by patterns produced under mss-polarized optical microscopy and also by low angle X-ray diffraction. Emulsion Preparation: Water and polysorbate-80 are mixed and soy oil added with thorough mixing. Centrifugation of the W/O emulsion separated the oil and aqueous phases which were used as described below. Evaporation Studies: Samples of water, fragrance oil, surfactant were stirred in a Petrii dish at 22øC and weight monitored. At certain points along the evaporation path, determined by weight loss of water, samples were subjected to gc analysis to determine vapor pressure. For the microscopic observation studies of W/O emulsions, a small droplet of oil was placed on a microscope slide and aqueous solution introduced with a syringe and the changing phase behavior observed under crossed polarized microscopy and weight changes monitored. For O/W emulsions, the emulsion is applied to a confined area of a slide and visually observed under the microscope during evaporation. RESULTS AND DISCUSSION: Liquid crystalline phases can be formed in even simple systems such as sccn in Figure 1. Surfactant association structures are formed from water and surfactant. A miceIlar solution is formed up to 40% surfactant (in equilib- rium with oil) after which a hexagonal liquid crystalline phase appears. This is in equilibrium with oil and an aqueous solution with maximum surfactant. Another triangular 3-phase region is sccn with the hexagonal liquid crystal in equilibrium with the oil and a surfactant-oil (L2) solution. Evaporation paths for the W/O and O/W emulsions are traced with a dashed line. The W/O emulsion of water, soy oil and polysorbate-80 between crossed polarizers under the optical microscope is shown Figure 2. Initially, the view is black for the oil and aqueous isotropic liquid phases. Photo 1 shows a thin radiant band which appeared as the liquid hexagonal crystalline phase appears at point b on the phase diagram in Figure 1. This birefringent area grew (photo 2) to cover the entire droplet, seen in photo 3. Photo 4 shows the liquid crystalline phase diminishing as it is replaced by isotropic solution the droplet again appears black at the end (photo not shown).
Purchased for the exclusive use of nofirst nolast (unknown)
From: SCC Media Library & Resource Center (library.scconline.org)