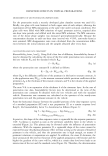
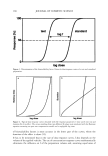
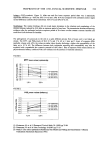
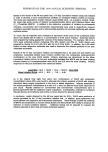
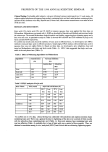
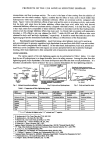
PREPRINTS OF THE 1998 ANNUAL SCIENTIFIC SEMINAR 201 Clinical Testing: Ten healthy adult subjects, who gave informed consent, participated in a 12 week study. All subjects applied anhydrous and aqueous base products containing kojic acid and a retail product containing hydro- quinone on their forearms twice daily. Baseline and 24 hours later, chromometer measurements were taken at each of the test sites. RESULTS AND DISCUSSION: Kojic acid (1%), lactic acid (3%) and 1% MAP in nonionic aqueous base were applied for three days on Mclanoderm. Melanoderm was treated with L -DOPA as described in Materials and Methods and examined under the microscope. The treated Melanoderm looked dendritic and healthy, suggesting that whitening agents and a base were not toxic. A quantitative analysis (Table-1) showed 48% and 46% and 33% inhibition by kojic acid, lactic acid and MAP respectively. To confirm our results and check the stability of kojic acid in different bases, we developed a new HPLC method to measure kojic acid in different products. Surprisingly, HPLC analysis showed that kojic acid in aqueous base was not stable (Table-2). Based on these data, we developed a new anhydrous base and tested on Melanoderm with kojic and lactic acids (Table -1). HPLC data suggested that kojic acid was stable in the anhydrous base (Table -2). Table 1 Effect of whitening ingredients on Melanoderm Ingredients Concentrations Tyrosinase Inhibition (%) (%) Aqueous Base Anhydrous Base None 0.00 0.00 0.00 Kojic acid 1.00 47.98 41.00 Lactic acid 3.00 46.20 22.00 MAP 1.00 33.55 ND Table 2 HPLC analysis of kojic acid Base/Vehicle I Time (weeks) Kojic acid concentration (%) 25 ø C Lost 37 ø C Lost (%) (%) (%) (%) Aqueous 0.00 1.15 0.00 ND ND 2.00 1.23 0.00 0.98 14.79 5.00 0.14 87.83 0.18 86.35 Anhydrous 0.00 0.99 0.00 ND ND 8.00 ND ND 0.78 21.22 12.00 ND ND 0.80 19.20 26.0 0.97 2.03 ND ND To confirm our in vitro data, clinical testing was conducted with anhydrous and aqueous nonionic bases containing kojic acid. There was a gradual increase in lightening of the skin over a period of three months with the anhydrous base containing kojic acid (Table -3). Non-ionic aqueous base containing kojic acid was less effective (Table -3), probably due to loss of kojic acid over a period of three months. Thus, we obtained a correlation among in vitro, analytical (HPLC) and clinical data on whitening/lightening agents.

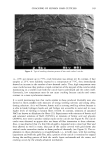
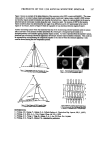
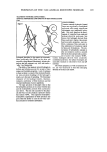
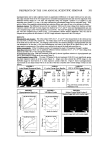
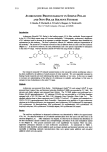
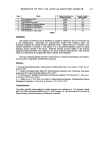
202 JOURNAL OF COSMETIC SCIENCE Table $ Clinical study on skin whitening by chromometer Products Change from no treatment (%) Kojic acid I Month p 2 Months p 3 Months p value value value Aqueous base 0.00 0.95 0.9 0.029 0,2 0.73 Anhydrous 0.80 0.09 1.6 0.006 2.6 .0003 base Hydroquinine 1.10 0.05 0.2 0.61 2.8 0.019 product Bold: Significant p values. Patent pending. * Y. L. worked at Mary Kay Holding Co. A SENSITIVE AND QUANTITATIVE SPLIT-FACE CLINICAL PROTOCOL TO DISCRIMINATE COSMETIC FORMULATIONS FOR FACIAL HYPERIGMENTATION REDUCTION EFFICACY Kukizo Miyamoto and Greg G. Hillebrand INTRODUCTION: Procter & Gamble Far East, Inc., Kobe, Japan Facial skin hyperpigmentation, e.g., senile lentigines, freckles, post-inflammatory hyperpigmentation, and melasma, is a problem for all peoples of the world but is particularly problematic for Asiansl, 2. Sound clinical data that unequivocally proves the visible skin benefits afforded by skin lightening and/or hyperpigmented spot reduction formulations is frequently needed for claims support and regulatory approval. Split-face paired comparison testing has proven to be quite useful in dermatology for treatment efficacy assessment for various skin disorders, especially acne 3. In this paper, we present results that demonstrate the sensitivity and efficiency of a split-face clinical design combined with high resolution video imaging to discriminate cosmetic formulations for hyperpigmentation reduction efficacy. CLINICAL METHODS: Design: Randomized split-face double blind paired comparison study. Study Period: February-August, ! 997. Subiects: 120 Japanese females, 25-60 years, with moderate to severe hyperpigmentation on both sides of the face. Test Treatments and Regimen: Subjects (60 per group) were instructed to apply a test formulation (0.26g) to one side of their face and to apply another formulation to the other side twice a day (morning/evening) for 6 months. Test treatment pairs were randomized right/left and were: One Side of Face Other Side of Face Leg I SLM = A commercially marketed Skin Lightening NM = A commercially marketed Norma• Moisturizer containing a mixture of MHW-approved skin vs. Moisturizer without skin lightening active• lightening actives (Max Factor Natique CR White) (Oil of Olay Sensitive Skin Beauty Fluid) 1 Leg 2 E = A commercially marketed Essence containing a vs. V = SK-II Facial Treatment Repair C Vehicl• yeast-conditioned culture medium ,(SK-II Facial (yeast-conditioned medium is replaced b 1 Treatment Repair C) : water) Skin Measures: Video images of the left and right sides of the subject's clean face were collected at baseline, 1, 3 and 6 months of treatment using a Sony DXC-537H 3CCD color TV camera with a Canon J I5x9.5 BKRS lens equipped with a polarizing filter. Facial illumination was provided by two Balcar Flux-Lites equipped with flux tungsten light bulbs (3500øK) positioned above and below the camera to provide even lighting of the side of the subject's face. Accurate repositioning of the subjects was facilitated by superimposing the live image on the digitally-stored image obtained at baseline. A color chart was used as a standard to calibrate the imaging system each study day. Computer analysis of the video images allowed quantification of basal skin color tone (L*a*b*) and hyperpigmcntcd spot area (mm 2) of pigmented maculcs. Reproducibility and Accuracy: The intra-subjcct coefficient of variance (COV) of L*, a*, and b* values and hyperpigmented spot area for five video images of the same subject (images spaced 10 min. apart) were determined over five subjects. Accuracy was determined using Asian and Caucasian mannequin heads (Figure I) to which circular artificial spots of known area were applied the computer image-analyzed area was compared to the true area. Visual Perception System (VPS): Judges (n=7) viewed each subject's pre-trcatment (baseline) rs. post-treatment (1, 3 or 6 month) facial images side by side on a calibrated video monitor (Barco Type 121). The judge was blind to which image was predpost treatment and the identity of the test treatment. The judges were trained to recognize melanin
Purchased for the exclusive use of nofirst nolast (unknown)
From: SCC Media Library & Resource Center (library.scconline.org)