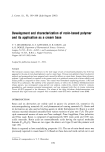
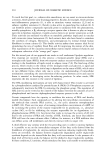
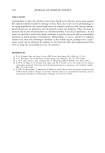
DSC ANALYSIS OF HAIR IN WATER 221 intervals, yielding eleven hair swatches with different chemical histories. DSC tests on the samples were conducted three times. DATA ANALYSIS Figure 1 shows a DSC curve typical for untreated human hair in water. In accordance with conventional practice in calorimetry, endothermic effects, i.e., heat absorption by the sample, are represented by an increase in the ordinate value from the baseline. The DSC peak is characterized by its position (peak temperature), which is taken as the denaturation temperature T O of the helical material in the IFs. The area of the peak with respect to its baseline yields the denaturation enthalpy AHr), which is the energy required for the helix denaturation. The enthalpy depends on the amount and the structural integrity of the o•-helical material in the intermediate filaments of human hair. There is good evidence to suggest (9,10), that T O is kinetically controlled by the cross-link density of the matrix (IFAPs) in which the IFs are embedded. The higher the cross-link density in the IFAPs, the higher their viscosity and the more hindered is the helix/coil transition in the IFs and vice versa. T D = 156,7øC 140.3øE /xHD = 17.9 Jig 168.2ø6 0 i [ I • 130 140 150 160 170 180 Temperctfure in øC Figure l. Typical DSC curve for untreated human hair in water. The location of the peak gives the denaturation temperature To, and its area, with respect to the baseline, gives the denaturation enthalpy AH D. The start and end temperature of the baseline, defining the peak, are marked.

222 JOURNAL OF COSMETIC SCIENCE On the assumption that AH o is a measure of the amount of native, (x-helical material, the relative helix content HXre / is given by: HXre/ = AHo/AHo ø (1) AHo ø is the arithmetic mean denaturation enthalpy for the start material for each specific part of the study. As a first approach and against the background of a previous investigation (11), first- order kinetics are assumed for the treatment-induced decrease of the helix content in terms of time: -dHX•//dt = ktHXre / (2) as well as of the number of treatments -dHX•/dn = k,HX•a (3) where k t is the reaction rate constant related to treatment time and k, the apparent reaction rate constant with respect to the number of treatments, respectively. In view of the properties of equations 2 and 3 after integration, plotting ln(HX•/) vs t or vs n should yield a straight line with the slopes -k t and -k,,, respectively. RESULTS AND DISCUSSION Bleaching and perm-waving lead to unique changes in the DSC curves of the treated hair. In this paper, results for the changes in the principal parameters, namely dena- turation temperature and enthalpy are presented and discussed. Tables I and II sum- marize the results for T o and AH o for the bleached and perre-waved samples, respec- tively, in the form of the arithmetic means and standard deviations. With values for the standard deviation for T o of generally around or less than IøC and of around 1 J/g or less for the denaturation enthalpy, the method shows good precision. The values for T o for the untreated samples (bleach: 158øC perm-wave: 155øC) as well as for AH o (bleach: 19.3 J/g perm-wave: 15.3 J/g) in both sets of experiments are in the usual range for (x-keratins (9). Table I Denaturation Temperatures T O and Enthalpies AH o for Hair Samples Bleached Multiple Times Number of bleachings T O + s (o) AH o _+ s (J/g) 0 158.3 + 0.34 19.3 + 0.41 1 157.8 + 0.18 18.0 + 0.21 2 152.6 + 0.47 15.6 + 1.13 3 145.3 + 0.39 13.7 +- 0.81 4 140.9 + 0.36 12.4 +_ 0.41 5 141.4 +_ 0.32 12.9 + 0.44 6 139.6 + 0.23 13.0 + 0.44 7 138.4 + 0.44 11.7 + 0.25 s: standard deviation for fivefold measurements. 0: untreated hair material.
Purchased for the exclusive use of nofirst nolast (unknown)
From: SCC Media Library & Resource Center (library.scconline.org)