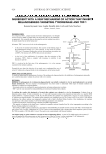
ANTIOXIDANT ACTIVITIES OF ESSENTIAL OILS 395 were of standard analytical grade and purchased from Echo Chemical Co. (Miaoli, Taiwan). GAS CHROMATOGRAPHY-MASS SPECTROMETRY (GC-MS) Analyses of the volatile compounds were tested using a Thermo GC-MS system (GC-MS Trace DSQ-Mass Spectrometer, MSD 201351, Thermo, Minneapolis, MN). An Equi- tyTM-5 capillary column (Supelco, USA) with a 30-m length and a 0.25-mm inside diam- eter was used with a 0.25-μm-thick fi lm. The oven temperature was programmed as follows: isothermal at 40°C, followed by a 5°C temperature ramp every minute to 100°C, which was held for fi ve minutes. Subsequently, the temperature was increased 5°C every minute to 250°C and held for 20 minutes. The carrier gas was helium (1 ml min-1). The injection port’s temperature was 250°C and the detector temperature was 250°C. Ioniza- tion of the sample components was performed in the EI mode (70 eV). The injected vol- ume was 1 μl. The linear retention indices for all compounds were determined by co-injection of the samples with a solution containing a homologous series of C8-C22 n-alkanes (21). The individual components were identifi ed by retention indices and com- parison with compounds known from the literature (22). Their mass spectra were also compared with known, previously obtained, compounds or from the Trace DSQ-MASS spectral database (Thermo, USA). DPPH FREE-RADICAL SCAVENGING ASSAY (DFRS) The antioxidant activities of twenty-fi ve essential oils were assessed by measuring their ability to scavenge the (stable) radical, 1,1-diphenyl-2-picrylhydrazyl. The DPPH assay was performed as described by Gyamfi et al. (23) with the following modifi cations. Two milliliters of test sample in an ethanol solution (1 mg ml−1) was added to 0.5 ml of 2.5 × 10⁻⁴ M DPPH ethanol solution. The reactive mixture and the blank were incubated in the dark at room temperature for 30 minutes. Ethanol (99.9%) was used as the control while BHT was used as the positive control. For each sample, three replicates were re- corded. The disappearance of DPPH was determined spectrophotometrically at 517 nm using a UV-vis spectrophotometer (SP-8001, Metertech Inc., Taipei, Taiwan). Inhibition of the free radical by DPPH as a percent (%) was calculated using the following equation: I % = [1 − (absorbance of sample at 517 nm /absorbance of control at 517 nm)] × 100%. The EC50 values were calculated by linear regression analysis, which was defi ned as the effective concentration of the sample to obtain 50% antioxidant. DETERMINATION OF TOTAL PHENOLIC CONTENT (TPC) The total phenolic content (TPC) was determined by the methods described by Kujala et al. (24) with the following modifi cations. The test samples were diluted to a suitable concentration for analysis. One half a milliliter from the test samples in an ethanol solu- tion (10 mg ml−1), was mixed with 1 ml of 1 N Folin-Ciocalteu’s reagent and 1 ml of 7.5% Na2CO3 (w/v). After three hours of incubation at ambient temperature, the sediment

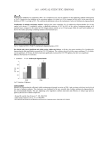
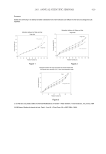
JOURNAL OF COSMETIC SCIENCE 396 and solution were divided by using a centrifuge at 3000 rpm for eight minutes. BHT was used as the positive control. Three replicates were recorded for each sample. The superna- tant was measured with a UV-vis spectrophotometer (SP-8001, Metertech Inc., Taipei, Taiwan) at 760 nm. Different concentrations of gallic acid (10-100 μg/ml) were deter- mined by a calibration curve (y = 45.318x − 0.0181 γ 2 = 0.999 y is the concentration of gallic acid, x is absorbance). The results were shown as micrograms relative to gallic acid equivalents (GAE) per 10 mg of essential oil. TROLOX EQUIVALENT ANTIOXIDANT CAPACITY (TEAC) ASSAY The trolox equivalent antioxidant capacity (TEAC) assay was determined by methods de- scribed by Erkan et al. (16) with the following modifi cations. When ABTS and potassium peroxodisulfate were mixed in a pH-7.4 phosphate buffer solution (PBS), followed by in- cubation in the dark for 16 hours, a blue-greenish ABTS+ solution results. The fi nal con- centrations were 7 mM and 2.45 mM. Next, 300 μl of ABTS+ solution was diluted with PBS to 20 ml, and that solution was incubated in the dark for one hour. After 1mg ml−1 of the test sample (20 μl with 1980 μl dilute solution) was mixed and allowed to react for ten minutes, the absorbance was measured at 730 nm by a UV-vis spectrophotometer (SP-8001, Metertech Inc., Taipei, Taiwan). Trolox (25–800 μM) was used in different concentrations (as standards) to create a calibration curve (y = −3497.2x + 1466.4 γ2 = 0.999 y is the concentration of trolox, x is absorbance) to fi nd the relative concentration of trolox in each sample. BHT was used as the positive control. For each sample, three replicates were recorded. The results were shown as μM of trolox per milligram of essential oil. FERRIC THIOCYANATE (FTC) ASSAY The antioxidant activity analysis was performed by ferric thiocyanate according to the pro- cedure reported by Osawa and Namiki (25) and Zainol et al. (26) with the following mod- ifi cations. The test samples (1 mg) were dissolved in 1 ml of ethanol, and mixed with linoleic acid (2.5%, v/v), 99.9% ethanol (1 ml), and 2 ml of 0.05 M sodium phosphate buf- fer (pH 7). The solution was incubated at 40°C for 240 h. Next, 1.7 ml of 75% ethanol, 0.1 ml of 30% ammonium thiocyanate aqueous solution, and 0.1 ml of ferrous chloride solution (20 mM in 3.7% HCI) were sequentially added to 0.1 ml of sample solution. After ten minutes of stirring, the absorbance was measured at 500 nm by using the ELISA (SunriseTM, Tecan Group Ltd., Männedorf, Switzerland). A control was performed using linoleic acid without the essential oils. BHT was used as the positive control. For each sample, three replicates were recorded. Inhibition of linoleic acid peroxidation was expressed as a percent- age and calculated using the following equation: Inhibition of linoleic acid peroxidation % = [1− (Abs increase of sample at 500 nm/Abs increase of control at 500 nm)] × 100%. STATISTICAL ANALYSIS Data were presented as the mean ± standard deviation (S.D.) from three independent experimental determinations. Statistical analyses were performed using a one-way analysis
Purchased for the exclusive use of nofirst nolast (unknown)
From: SCC Media Library & Resource Center (library.scconline.org)