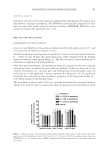
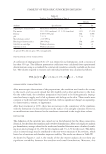
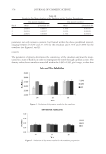
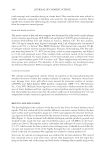
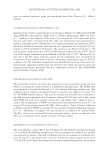
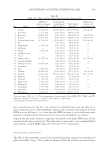
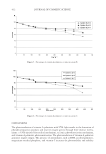
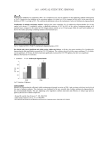
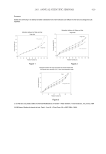
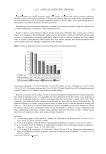
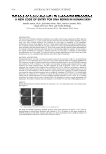
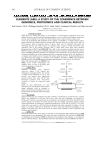
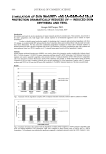
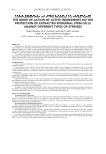
PANTHENOL IN SKIN MOISTURIZATION 365 STATISTICAL ANALYSIS Parametric tests were selected for statistical analysis of the experimental data points, since they showed a Gaussian distribution. The ANOVA test was used for comparison of mul- tiple measured data points using the statistical software, MINITAB. Differences were accepted as statistically signifi cant at p 0.05. RESULTS AND DISCUSSION DETERMINATION OF CLINICAL EFFICACY Long-term study. Biophysical measurements before and after daily applications for 15- and 30-day periods are reported in Figures 1 and 2. All the formulations studied produced a signifi cant increase in stratum corneum moisture (p 0.001) 15 and 30 days after daily application, when compared with the baseline values and with the control group (Figure 1). The effect was more evident with the use of formulations supplemented with panthenol. After long-period treatments, all formulations produced a signifi cant increase in stratum corneum moisture, including the ones without panthenol. Other raw materials in this cosmetic formulation (i.e., sclerotium gum and hydrogenated and ethoxylated castor oil) could also act on the epidermis, causing improved skin hydration (24). No signifi cant alterations were observed in skin viscoelastic properties in the long-term studies ( p 0.05) when compared with baseline values. The viscoelastic-to-elastic ratio (Uv/Ue) is a parameter obtained by cutometer analysis, which can be used not only to evaluate skin elasticity properties but also hydration of the Figure 1. Water content of the stratum corneum before (baseline values) and 15 and 30 days after daily application of the formulations: vehicle (V), V+0.5%, V+1.0%, and V+5.0% of panthenol and control site (ANOVA test, n = 20 subjects, mean ± SEM). ∗Signifi cantly different from the base values and control site ( p 0.001).

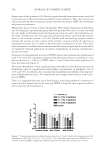
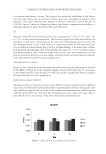
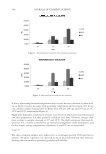
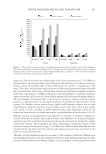
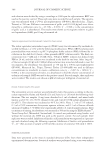
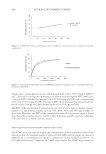
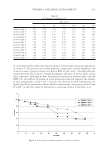
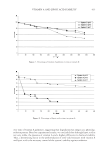
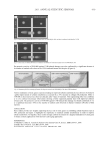
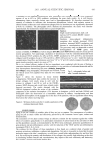
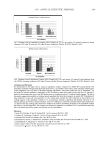
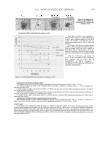
JOURNAL OF COSMETIC SCIENCE 366 deeper layers of the epidermis (19). Results suggest that the formulations under study did not present any of the above-mentioned effects on the epidermis. They seem to have not only a moisturizing effect on stratum corneum but they also reduce TEWL due to fi lmogen and protective properties. Moisturizers may act by an occlusive mechanism. They impair evaporation of skin mois- ture by forming an epicutaneous greasy fi lm that prevents water loss, as is the case with the oils, lipids, and hydrogenated and ethoxylated castor oil used in the formulation un- der study. A humectant activity by glycerin and urea may attract water from the environ- ment to the stratum corneum (2,25,26). Studies with moisturizing products should evaluate the increase in water content of the stratum corneum and also the decrease in transepidermal water loss, in order to determine their mechanism of action. Thus, mul- tiple assessments to evaluate barrier function and the raising of questions about the effects of cumulative repeated application of cosmetic formulations on stratum corneum func- tion are necessary. Evaluation of transepidermal water loss (TEWL) showed that formulations supplemented with 1.0% and 5.0% of panthenol improved the skin barrier function, resulting in a sig- nifi cant decrease (p 0.001) in TEWL values 15 and 30 days after daily application of these formulations (Figure 2). This result showed that to have signifi cant long-term effects on skin barrier function, the formulation must be supplemented with higher concentrations of panthenol, such as 1.0% and 5.0%. In addition, the concentration of panthenol also infl uenced the improve- ment of skin hydration since 1.0% of panthenol was enough to show effi cacy in the reduc- tion of TEWL. Thus, it is suggested that daily use of formulations containing panthenol is important to protect the skin barrier function by reducing TEWL, to keep the skin in good condition, and to maintain skin homeostasis. Figure 2. Transepidermal water loss before (baseline values) and 15 and 30 weeks after the application of the formulations: vehicle (V), V+0.5%, V+1.0%, and V+5.0% of panthenol and control site (ANOVA test, n = 20 subjects, mean ± SEM). ∗Signifi cantly different from the base values and control site ( p 0.001).
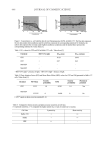
Purchased for the exclusive use of nofirst nolast (unknown)
From: SCC Media Library & Resource Center (library.scconline.org)