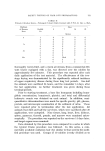
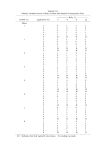
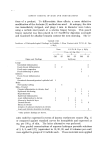
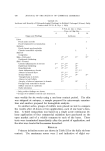
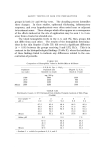
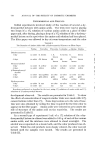
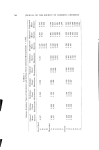
SAFETY TESTING OF HAIR DYE PREPARATIONS 759 groups in both 21- and 90-day tests. The abrading process intensifies these changes. In these studies, epidermal thickening, inflammatory responses, and even hyperkeratosis were often noted near or adjacent to treatment zones. These changes which often appear as a consequence of the effects induced at the site of application may be seen 1 to 3 cm. away from a treated or abraded area. The blood hemoglobin levels in the 3, 6, and 9% H202 groups did not differ from each other. The results of the hemoglobin determina- tions in the skin biopsies (Table XI) did reveal a significant difference (p = 0.05) between the groups receiving 3 and 12% H202. This is in contrast to the histopathological findings (Table X), where the incidence of these findings failed to indicate any differences related to the con- centration of peroxide. TABLE XII Comparison of Hemoglobin Values in Rabbit Skin at 48 Hours - P.P.D.-R. Dye q- H202, Depilated Depilated and Clipped •/•-•/• in. (no wash) Abraded (no wash) (wash at 1 hour) Means mg./100 g. 1630 28.30 1330 2170 3550 860 2350 3380 950 2050 3250 1050 TABLE XIII Erythrocyte Counts (X l0 s) Estimated from Alkaline Hematin Analysis of Skin Plugs (Rabbit) Dye sample --• 1 a 2 3 4 5 pH --• 9.0 9.7 9.5 8.8 9.3 67.5 95.0 83.0 86.5 85.0 48.5 90.0 74.0 77.5 98.7 40.5 83.0 85.0 81.3 91.3 44.0 73.0 73.0 83.0 Means 51.0 •5.2 •1.0 79.6 89.6 Saline, pH 8.0 9.0 7.0 67.5 62.5 56.3 41.0 48.0 42.5 33.7 46.3 42.5 Means •7.4 52.1 •5.3 Product I = vehicle for products 2, 3, 4, and 5.

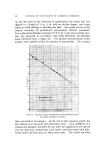
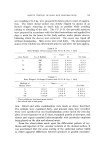
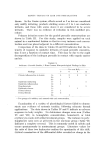
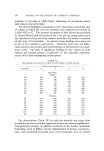
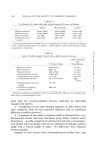
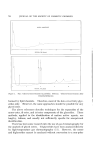
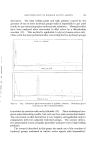
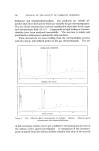
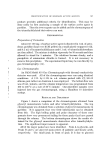
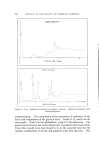
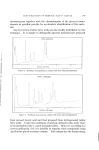
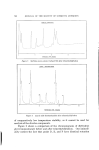
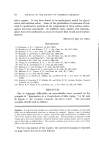
76O JOURNAL OF THE SOCIETY OF COSMETIC CHEMISTS To ascertain effects at 48 hours, in rabbits treated by both the pro- longed and the one-hour contact procedures, animals were sacrificed, the application sites examined, and skin plugs cut and prepared for hemoglobin analysis. The results are shown in Table XII. Marked differences in the values were observed between the untreated and treated skin. In each case, the treatment dicited increased quantities of hemoglobin-bearing red cells at the sites of application. The quanti- tative differences suggest that those animals treated by prolonged con- tact showed the more marked responses. Data from the comparison of commercial oxidation dye preparations are shown in Table XIII. Product "1" was the vehicle for the various dyes. Products 2, 3, 4, and 5 were dye mixtures to be evaluated. The vehicle was included in order to assess the effects of the mechanics of the treatment. All, including product "1," were prepared with appro- priate peroxide solution and applied for a one-hour period. The animals were sacrificed immediately thereafter and the skin subjected to the alkaline hematin test. For each product, replicate applications were made to a series of sites. Untreated controls and pH-adjusted saline were included. Data for these analyses are shown as red cell counts, read from a standard curve (Fig. 1). The values for products 2, 3, 4, and 5 are significantly higher than those for product "1," the vehicle, the pH-controlled saline, or the untreated skin (Table XI). These data generally correlated with the edema and erythema seen on ex- posure of the dermal surface of the skin. To ascertain whether these alkaline hematin determinations are SKIN PUNCH mascerated with ionic buffer centrifuged Supernatant dialyzed I Residue lyophilized 25% Suspension I Dialysate con- tains no Fe [ Normal electro- Normal electro- phoretic pattern phoretic pattern for hemoglobin for serum
Purchased for the exclusive use of nofirst nolast (unknown)
From: SCC Media Library & Resource Center (library.scconline.org)