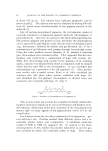
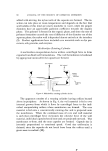
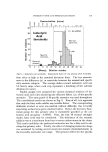
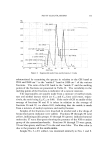
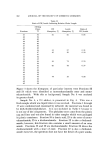
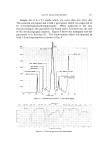
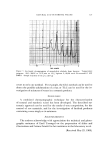
FATTY ALKANOLAMIDES 109 RESULTS Five different samples from three different suppliers were examined. Four of the samples were considered fresh in that they were made two weeks prior to their analysis. One sample analyzed was two years old. Two of the samples were the superamide type and three were of the Kritchevsky type. One sample was analyzed twice because it was re- ceived as a liquid and after a few weeks it started to solidify. There was interest in knowing what, if any, chemical change took place in changing from a liquid to a solid. The results of the six samples are shown in Table I. Table I Comparative Analysis of Various Amides (Values shown as percentages) No. 1 No. 2 No. 3 No. 4 No. 5 No. 6 Free fatty acid 1.21 1.14 7.94 DEA amide diester 5.36 0.58 0.00 DEA amide monoester 0.00 0.63 0.00 Amine diester 0.00 0.00 0.00 MEA amide ester 0.53 0.90 MEA amide 2.27 1.35 DEA amide 86.31 88.65 49.02 Free amine 35.60 Amido-amine 4.12 5.18 Free amine plus soap 3.00 6.20 4.00 0.00 2 44 0 00 0 40 2 5O 53 85 32 41 4 10 2.60 3.74 5.45 O. 80 6.94 2.65 O. 97 O. O0 O. 45 O. 50 2.40 52.16 62.26" 27. O0 27.20 2.04 Contained piperazine derivative. In Table I, Sample Nos. 1 and 2 were the superamides, and the other four were the 2:1 ratio amides. Histograms of the six samples were made in which the weights of the eluted fractions were plotted versus the fractions. The histograms indi- cate the number of major components that were in the product. The infrared spectra of the peaks of the plotted fractions when carefully evaluated revealed the composition of the components. It was found that in several instances it was necessary to obtain an infrared spectrum of not only the peaks, but also of the fractions before and after the peaks. This was necessary because some of the components are similar in polarity and as a result they will be eluted close to each other. The infrared spectra were able to show the distinguishing functional groupings of the components.

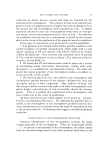
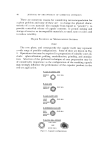
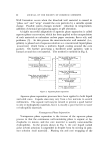
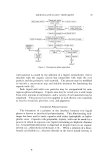
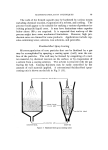
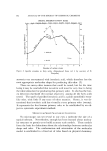
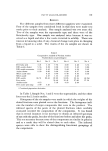
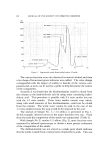
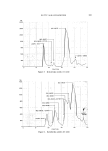
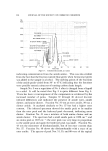
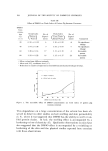
11o JOURNAL OF THE SOCIETY OF COSMETIC CHEMISTS Mg 4000 3000 2000 iooo 75O 5OO AMIDE I I ' * 20 30 40 50 FRACTION Figure 1. Superamide made from methyl esters, 1:1 ratio 2501 0 ', ' o DI ESTER AMIDE, LAURIC ACID I0 The various fractions were also dissolved in neutral alcohol and then a few drops of bromcresol green indicator were added. The color change corresponded with the degree of acidity or basicity of the various com- ponents and, as such, can be used as a guide to help determine the nature of the components. As stated, it was found that the diethanolamine could be eluted from the column as the hydrochloride salt by using water containing hydro- chloric acid. This procedure is possible with 2:1 ratio amides but not with the 1:1 ratio amides. These latter amides contain soap which, along with small amounts of free diethanolamine, could not be eluted from the column. The acidic water cannot be used in the case of the 1:1 ratio amides because the soap would be decomposed by the acid. The analysis of Sample No. 1, a 1:1 adduct, is presented in Fig. 1. In this example, infrared curves on the major fractions were run. From these fractions the composition of the amide was summarized (Table I). With Sample No. 2, another 1:1 adduct (Fig. 2), more fractions were examined by infrared spectroscopy to obtain a more precise evaluation of the composition of the amide. The diethanolamide was not eluted as a single peak which indicates that the amide is made from a methyl ester of mixed fatty acids. This was
Purchased for the exclusive use of nofirst nolast (unknown)
From: SCC Media Library & Resource Center (library.scconline.org)