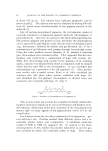
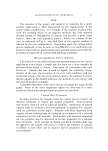
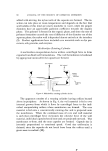
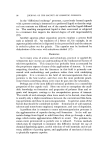
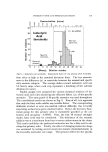
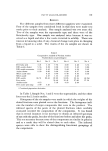
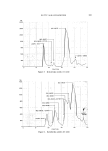
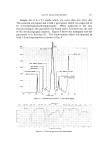
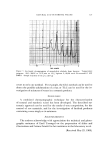
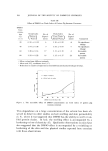
FATTY ALKANOLAMIDES 115 FREQUENCY 10000 5000 4000 3000 2500 2000 ]800 1600 1400 1200 100 -- •:• .... • ::: •T I •4 ' c80 • • !J ,? , : __ i I j J ..... i i ' L 8 9 WAVELENGTH (MICRONS) 10000 5000 4000 _ - 100 -- I I C80 -- Z , •60 •40' i •20 -- 3000 2500 2000 1800 1600 I i 8C0 750 700 650 : .... I I I , I • , I i I ' , [ J i i • •,, ,,,• z ........ - ...... J 11 12 13 14 15 FREQUENCY (CM I) 1400 1200 1000 950 900 850 j, 2 6 7 8 9 WAVELENGTH (MICRONS) [ I 750 700 6S0 , , Figure 6. Infrared spectra of a diester amide before heating (top) and after heating (bottom) diethanolamide. Again, the spectra when comparing the "CH" band with the "amide I" band showed the presence of varying length carbon chains. Fraction No. 64 is a mixture of an amide and amido-amine. This was demonstrated when an alcoholic solution of this fraction turned blue upon adding bromcresol green indicator, whereas the fractions prior to it were green. Sample No. 4 changed into what is called Sample 5 in the course of three weeks at room temperature. The change is due to a rearrangement of some of the components of the sample. The change was demonstrated by taking two of the fractions, namely Nos. 39 and 51 from sample No. 5 and heating them for 20 hours at 105øC to accelerate any possible re- arrangement. Fraction No. 39, which was a mixture of diester amide and monoester amide, upon rearrangement gave a sample whose infrared curve showed diester amine contaminated with diester amide, proving the monoester amide is thermally unstable. The pH increased by the color test with bromcresol green. Figure 6 shows the infrared curves of Sample 39 before heating, and after heating. It is interesting to note that the infrared curve after heat- ing is very similar to Fraction 41.

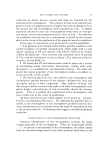
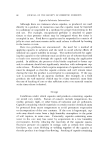
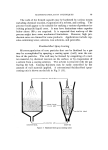
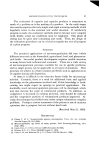
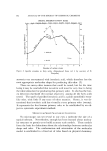
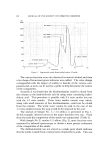
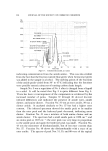
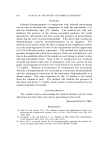
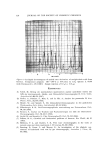
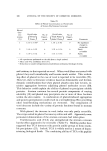
116 JOURNAL OF THE SOCIETY OF COSMETIC CHEMISTS The chemistry of the reaction is shown below (equation 1): o o II /C•.H•OH II CnH•.aC--NL%c•.H•OCCnH• a • (CnH•aCOC•.H•)•.NH (1) O Fraction No. 51, which is a diethanolamide, when heated rearranged to a monoester amide. Figure 7 shows the infrared curves before and after heating. The reactions were: CnH•.•C--N(C•.H4OH)•. • CnH•.•C--OC2H4N--C•.H4OH (2) O O H /C•H4OH 2(CnH2•C--OC•.H4NC•.H4OH) • CnH•.•C--OC•H.N--( q- HN(C•H4OH)• (3) II I II •CC•iH,• O H O II O The rearrangement takes place in two steps. The fraction was very basic, turning blue, when tested with the indicator. The melting points of the amide fractions indicated eutectic mixtures. • 40 - -- , _ • 2 10000 5000 4000 3000 2500 2000 1800 1600 T FREQUENCY (CM) 1400 1200 1000 950 900 850 800 750 700 _ 650 3 4 5 6 7 8 9 10 11 12 13 14 15 WAVELENGTH (MICRONS) FREQUENCY (CM ') 10000 5000 4000 3000 2500 2000 1800 1600 1400 1200 1000 950 900 850 800 750 700 650 • 4o • I Y ' J' • , • 2o i 2 3 4 5 6 7 8 9 10 11 12 13 14 15 WAVELENGIH (MICRONS) Figure 7. Infrared spectra of a pure diethanolamide before heating (top) and rearranged to a monoester after heating (bottom)
Purchased for the exclusive use of nofirst nolast (unknown)
From: SCC Media Library & Resource Center (library.scconline.org)