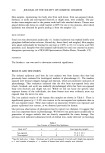
220 JOURNAL OF THE SOCIETY OF COSMETIC CHEMISTS anhydrous substance throughout this paper) is a naturally occurring lipid with polar surface-active properties, and it contains a high proportion of cholesterol and fatty acids, the majority of which are esterified. This similarity of lanolin to some components of the intercellular lipids suggests that lanolin molecules may have little difficulty in being incorporated in such bilayer structures. Lanolin has long been recognized as an effective moisturizer for the skin, and this function has recently been demonstrated and quantified by Clark (4). It is readily absorbed by the stratum corneum, and about 2 to 3 mg cm-2 can be absorbed with no residual surface film. These attributes of the substance, together with the facts that it shows a very low incidence of specific allergy among the general population (5-9) and has a history of safe use extending back over centuries, has led to the widespread use of lanolin in cosmetics and pharmaceuticals intended for topical applications. An investigation directed toward elucidating the mode of action of lanolin in the stratum corneum has now been started, and the present paper represents the first phase of the work. It is a quantitative study of the depth within the stratum corneum to which lanolin penetrates after application to the surface at a specific loading. The actual location of the absorbed substance (for example, whether it lies between corneocytes, in sweat ducts, or in hair follicles) is being investigated separately, but it has already been shown that lanolin does not merely lie in the natural folds and crevices in the skin's surface (1). The basis of the present methodology was to apply lanolin at a specific loading to stratum corneum in vivo, after which the treated area of skin was removed a layer at a time by 30 successive tape strippings, sufficient to expose the stratum lucidum. The lanolin contents of the tape strippings were quantitatively determined by a sensitive spectrophometric method described later. Several types of adhesive tape were evaluated, but most were impracticable because they caused severe interference in the colorimetric test method for lanolin. Scotch Magic Tape © was found to cause very little interference, and even this could be compensated for in the blanks used, and so this particular brand of tape was used in the work. QUANTITATIVE DETERMINATION OF LAiNOLIN A sensitive method of qualitative and quantitative analysis of skin lipids was described by Okamoto (10) but was considered unsuitable here, since it is based on thin layer chromatography. Lanolin, a very complex mixture, gives multiple spots by such a technique, making quantification difficult. Instead, a method was chosen based on the well-known Liebermann-Burchardt reaction, in which certain of the steroidal compo- nents of lanolin give a green color when dissolved in a mixture of chloroform and acetic anhydride treated with concentrated sulphuric acid. The resultant color is amenable to spectrophotometric determination (11). For present purposes the methodology was not fully developed statistically, but it is estimated to give a reliable limit of determination in the region of 50 Ixg of anhydrous lanolin and a limit of detection of about 10 Ixg. The method requires a calibration graph, the derivation of which is described in detail in Appendix 1.

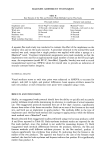
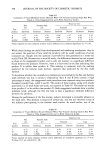
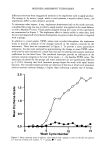
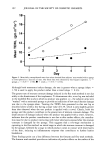
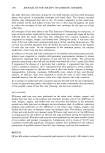
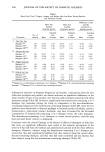
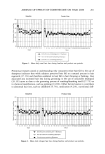
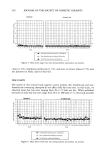
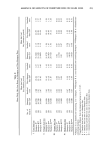
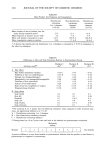
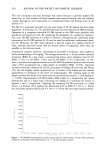
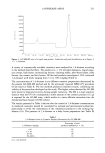
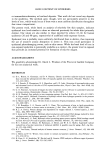
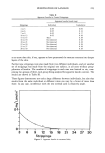
PENETRATION OF LANOLIN 221 The extent of any interference by steroids present in the natural intercellular lipids has been quantified and allowed for. GENERAL METHODOLOGY MATERIALS AND EQUIPMENT Scotch Magic © adhesive tape Glass fiber filter papers (Whatman GF/C, 11.0 cm) 55-mm glass funnels Glass rod, 120- x 5-mm flattened and flame-polished at one end 50-ml graduated stoppered glass cylinders Template, 20- x 10-mm rectangle cut in acetate sheet PROCEDURE The test subject was a 68-year-old male. A rectangular area 2 x 1 cm was marked out on the flexor surface of the inner forearm using a graphite pencil and the template. 4.2 mg of lanolin, weighed on a glass coverslip, were applied to this area and gently rubbed until absorbed, using the flame-polished glass rod. Ten minutes after application, tape stripping was commenced. Each stripping consisted of a 4-cm length of tape covering the test area, applied by thumb pressure for ten seconds and then removed by forceps. Successive strippings were collected in groups of three, each group being put into a 50-ml stoppered glass cylinder. To each cylinder 13.5 ml of chloroform were added, and after ten minutes the cylinder was shaken, causing the tape partially to disintegrate. 11.5 ml of acetic anhydride were then added, and the cylinder was reshaken, completing the disintegration of the tape and dissolution of any lanolin present. 0.5 ml of concen- trated sulphuric acid was added, another shake given, and the mixture immediately filtered through a glass fiber filter paper and filled into an optical cell. Simultaneously a blank was prepared from 12 cm of virgin tape, treated in a manner similar to the actual test. As the green color in the test mixture developed, the absorbance at 458 nm and 25øC was continuously monitored on the spectrophotometer until a maximum had been reached and just passed. The maximum reading was taken as definitive. The coverslip and glass rod used for lanolin application were washed with chloroform, and the residual lanolin thus recovered was determined by the same method as used for the tape strippings. The mass balance is shown in Table I, and essential results plotted as a graph are shown in Figure 1. The cumulative recovery oflanolin from all sources was 4.33 mg out of 4.20 mg applied (103.1%). Even though this recovery was excellent, since it was slightly in excess of the weight applied, it was necessary to ascertain to what extent natural steroids in the stratum corneum of the test subject had contributed to the measured amounts of lanolin. Accordingly, the whole experiment was repeated on the same subject, but this time without applying any lanolin. Faint positive reactions were found up to and including the fifth group of strippings, the results being shown in Table II and Figure 2. The
Purchased for the exclusive use of nofirst nolast (unknown)
From: SCC Media Library & Resource Center (library.scconline.org)