Table II Loss (%) in Wet Mechanical Properties of Hair Exposed at Various RH Block A Work-to-20%-extension Time/RH 10 20 30 50 70 100 h 26.98 12.56 11.16 17.67 22.79 200 h 38.60 28.84 18.60 22.79 32.09 300 h 46.98 29.30 34.42 25.12 46.51 Stress-at-20%-strain Time/RH 10 20 30 50 70 100 h 22.73 11.36 11.36 13.64 20.45 200 h 38.64 27.27 18.18 18.18 29.55 300 h 47.73 27.27 31.82 22.73 43.18 Block B Initial modulus Time/RH 10 20 30 50 70 100 h 23.62 9.77 12.38 11.31 21.85 200 h 35.23 25.38 33.38 14.54 35.85 300 h 43.31 21.85 26.23 32.23 46.69 Post-yield modulus Time/RH 10 20 30 50 70 100 h 17.42 9.76 42.51 17.77 39.37 200 h 24.04 20.91 50.52 12.89 55.05 300 h 32.06 25.78 47.39 35.54 60.63 Work-to-break Time/RH 10 20 30 50 70 100 h 15.26 13.88 -2.02 19.02 19.09 200 h 31.02 29.21 4.05 13.81 7.66 300 h 41.43 24.15 11.71 13.88 23.14 Stress-to-break Time/RH 10 20 30 50 70 100 h 25.79 19.50 27.67 25.79 33.33 200 h 34.59 32.08 32.08 20.75 44.03 300 h 44.65 29.56 35.85 32.70 49.06 B•& C Turnover point Time/RH 10 20 30 50 70 100 h -11.44 -4.40 -24.04 -5.28 -27.74 200 h -9.94 -4.56 -24.66 -10.07 -40.51 300 h -9.33 -9.12 -21.92 -13.40 -36.54 Strain-to-break Time/RH 10 20 30 50 70 100 h -11.28 -3.86 -23.23 -4.10 -28.49 200 h -10.59 -4.11 -22.82 -9.42 -41.67 300 h -10.67 -8.14 -31.24 -14.08 -43.14
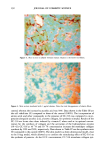
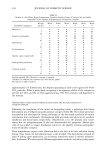
316 JOURNAL OF COSMETIC SCIENCE 5O e 30 2O 10 0 i i 100 hours 200 hours 300 hours 0 20 40 60 80 % RH Figure 4. Reduction in work-to-20%-strain of Piedmont hair exposed to simulated solar radiation. 50 ß 40 30 ß 2O 10 ß 100 hours ß 200 hours ß 300 hours 0 20 40 60 80 % RH Figure 5. Reduction in stress-at-20%-strain of Piedmont hair exposed to simulated solar radiation. ANALYSIS OF THE FTIR SPECTRUM The FTIR/ATR spectra obtained from Piedmont hair exposed for 300 hours at different RH levels are shown in Figure 7. The spectra were normalized using the absorbance at 1513 cm -1 (peak 1), the amide-II band, allowing a semiquantitative comparison of the cystine oxide content. A listing of the different absorbance peaks is given in Table III (2). The absorbances at 1042 cm 1 (peak 5) due to cysteic acid and at 1073 cm -• (peak 4) due to cystine monoxide, the primary degradation products of the disulfide links, indicate that irradiation at 20% RH caused the least amount of degradation. These absorbances for fibers exposed to radiation at other RH levels are essentially invariant, as shown in Figure 7. Since the beam essentially penetrated only the cuticle, the results suggest that damage to the cuticle is nearly identical for irradiation under different conditions over similar duration of exposure. This concurs with the results reported by Hoting eta/. (2). The low absorbances shown for exposure at 20% RH are probably due to experimental error. An important point to be noted is that cuticular damage, unless excessive, does not affect the tensile properties significantly (16). However, such damage is often the cause of crack initiation and fiber fracture. ROLE OF MOISTURE IN HAIR PHOTOLYSIS According to Arnaud (17), photolysis of hair proteins is caused by radiation with
Previous Page Next Page

Volume 49 No 5 resources

Extracted Text (may have errors)

314 JOURNAL OF COSMETIC SCIENCE Table I Wet Mechanical Properties of Untreated Piedmont Hair Initial modulus Work-to-20%- Work-to-break Stress-at-20%- (Gpa) strain (MJm 2) (MJm 2) strain (Gpa) 1.30 0.22 1.38 0.04 Stress-to-break Turnover strain Strain-to-break Post-yield modulus (Gpa) (% exm) (% exm) (Gpa) 0.16 32.35 61.06 0.29 monotonically with an increase in ambient moisture during irradiation, damage appears to go through a minimum. A second-order polynomial regression indicates that this behavior is characteristic of most mechanical properties, as shown in Figures 4 and 5. Hair fibers exposed at 10% and 70% RH show similar losses--about a 47% loss for a 300-hour exposure period--whereas the loss is only about 30% for exposure at 30% RH for 300 hours. Wool, another keratin fiber, also photodegrades in sunlight, Holt (15) reported that wool undergoes a high degree of photo-tendering and photo-yellowing on being irradiated at low humidity levels or in the presence of moisture. SWELLING RESULTS The extent of transverse swelling in 0.1 N sodium hydroxide solution of Piedmont hair irradiated for 300 hours at various RH levels is shown in Figure 6. Hair fibers exposed at 50% RH show the maximum swelling, 74%. Unlike the decreases in tensile properties, the extent of swelling goes through a maxi- mum. Swelling increases with the loss of crosslinks (8,9). Hence, the results suggest that hair exposed a high and low humidity levels have a larger number of crosslinks compared to hair exposed at intermediate humidity. This interpretation is inconsistent with the trend seen in the wet mechanical properties. This suggests that the swelling is caused by the degraded protein residues in the fiber. At high and low humidity levels, the proteins are extensively degraded and the residues have a molecular weight small enough to let them diffuse out of the fiber during exposure or immersion in 0.1 N sodium hydroxide solution. For exposure at intermediate humidity levels, the extent of degradation is less and the residues are large enough to be retained. This will lead to osmotic swelling of the fiber. This explanation is consistent with the trend seen in the wet mechanical properties. Isolation and identification of the residues that are cleaved and diffuse out of the hair fiber might offer support for the theory suggested. However, the short protein chains might diffuse during irradiation, during immersion in sodium hydroxide solu- tion, or both, thereby making the experiment contrived. An alternative theory may be supported by the work of Wolfram (6), in which exposure caused formation of secondary crosslinks between protein residues, in addition to ex- tensively damaging the fiber. The secondary crosslinks limited swelling without con- tributing significantly to the tensile properties. Exposure at low and high humidity levels favors crosslink formation as compared to exposure at intermediate levels. Hence, swelling passes through a maximum.
Table II Loss (%) in Wet Mechanical Properties of Hair Exposed at Various RH Block A Work-to-20%-extension Time/RH 10 20 30 50 70 100 h 26.98 12.56 11.16 17.67 22.79 200 h 38.60 28.84 18.60 22.79 32.09 300 h 46.98 29.30 34.42 25.12 46.51 Stress-at-20%-strain Time/RH 10 20 30 50 70 100 h 22.73 11.36 11.36 13.64 20.45 200 h 38.64 27.27 18.18 18.18 29.55 300 h 47.73 27.27 31.82 22.73 43.18 Block B Initial modulus Time/RH 10 20 30 50 70 100 h 23.62 9.77 12.38 11.31 21.85 200 h 35.23 25.38 33.38 14.54 35.85 300 h 43.31 21.85 26.23 32.23 46.69 Post-yield modulus Time/RH 10 20 30 50 70 100 h 17.42 9.76 42.51 17.77 39.37 200 h 24.04 20.91 50.52 12.89 55.05 300 h 32.06 25.78 47.39 35.54 60.63 Work-to-break Time/RH 10 20 30 50 70 100 h 15.26 13.88 -2.02 19.02 19.09 200 h 31.02 29.21 4.05 13.81 7.66 300 h 41.43 24.15 11.71 13.88 23.14 Stress-to-break Time/RH 10 20 30 50 70 100 h 25.79 19.50 27.67 25.79 33.33 200 h 34.59 32.08 32.08 20.75 44.03 300 h 44.65 29.56 35.85 32.70 49.06 B•& C Turnover point Time/RH 10 20 30 50 70 100 h -11.44 -4.40 -24.04 -5.28 -27.74 200 h -9.94 -4.56 -24.66 -10.07 -40.51 300 h -9.33 -9.12 -21.92 -13.40 -36.54 Strain-to-break Time/RH 10 20 30 50 70 100 h -11.28 -3.86 -23.23 -4.10 -28.49 200 h -10.59 -4.11 -22.82 -9.42 -41.67 300 h -10.67 -8.14 -31.24 -14.08 -43.14

Help

loading