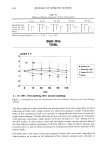
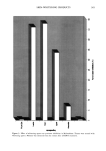
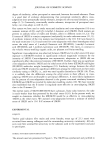
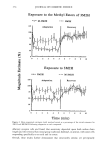
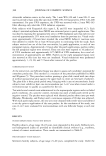
SKIN-WHITENING PRODUCTS 365 Figure 3. Effect of whitening agents on tyrosinase inhibition in Melanoderm. Tissues were treated with whitening agents. Melanin was extracted from the tissues after L-DOPA treatment.

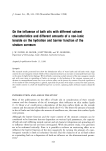
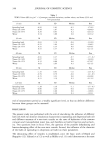
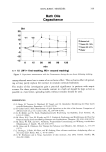
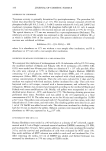
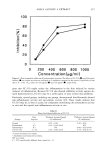
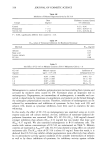
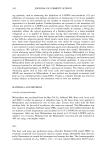
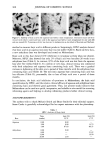
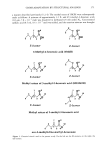
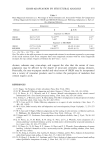
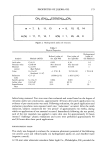
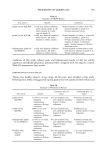
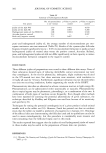
366 JOURNAL OF COSMETIC SCIENCE Figure 4. Stability of kojic acid in the aqueous base held at room temperature. Untreated tissues (A) were treated with vehicle control and kojic acid in the aqueous base held at room temperature for one week (B) and one month (C). Tyrosinase activity was detected in melanocytes as described in Materials and Methods. method to measure kojic acid in different products. Surprisingly, HPLC analysis showed that kojic acid in an aqueous non-ionic base was not stable (Table I). Based on these data, a new anhydrous base was developed and tested on Melanoderm. Kojic acid in this base showed 41% inhibition in tyrosinase activity (data not shown). Moreover, HPLC data showed that only 2% of kojic acid was lost after 26 weeks in an anhydrous base (Table I). In contrast, 87% of the kojic acid was lost from the aqueous base after five weeks (Table I). To confirm in vitro data, clinical testing was conducted with both anhydrous and aqueous bases containing kojic acid. There was a gradual increase in lightening of the skin over a period of three months with the anhydrous base containing kojic acid (Table II). The non-ionic aqueous base containing kojic acid was less effective (Table II), presumably due to loss of kojic acid over a period of three months. In conclusion, the kojic acid inhibition of tyrosinase in Melanoderm, the kojic acid quantification by HPLC, and the relative clinical efficacy of aqueous and anhydrous bases containing kojic acid showed good agreement. Thus, our present study indicates that Melanoderm can be used as a quick, inexpensive, and reliable in vitro model for screening whitening agents and helping to develop whitening products before clinical testing. ACKNOWLEDGMENTS The authors wish to thank Melanie Smith and Bruce Smith for their editorial support. Susan Cooke is gratefully acknowledged for her expert assistance with the photoshop. Table I HPLC Analysis of Kojic Acid Time Lost (%) Lost (%) Base (weeks) 23øC 37øC Aqueous Anhydrous 0.00 0.00 -- 2.00 0.00 14.79 5.00 87.83 86.35 0.00 0.00 -- 8.00 -- 21.22 12.00 -- 19.20 26.00 2.03 --
Purchased for the exclusive use of nofirst nolast (unknown)
From: SCC Media Library & Resource Center (library.scconline.org)