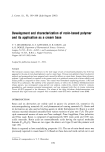
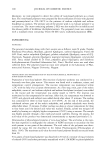
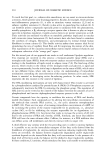
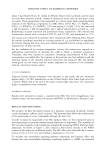
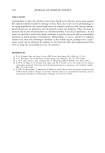
224 JOURNAL OF COSMETIC SCIENCE 160 155 ß ,-, 150 E 145 o 140 • 135 130 0 1 2 3 4 5 6 Number of Bleachings 20 Figure 2. Denaturation temperatures T O (left y-axis) and enthalpies AHr• (right y-axis) of the bleached samples as multiple "box & whisker" plot, characterized by the arithmetic means (symbol), the standard errors (box), and the expectation ranges for the 95% confidence limits (whisker). 0 refers to the untreated material. lO 135 y = -33.6 + 0.33 x r = 0.96 140 145 150 155 160 Denaturation Temperature in øC Figure 3. Individual values for denaturation enthalpy AH D plotted versus temperature TD for the bleached hair samples. The linear regression line through the data and its description are given. r is the correlation coefficient. They observed that with bleaching the DSC peaks for dry fibers shift to higher tem- peratures. This is in contrast to our results for wet fibers. Bleaching leads to increased concentrations of cysteic acid and thus of ionic interactions. It can be assumed that these will be effective in the dry fiber but will be broken in the wet state, thus leading to different shift directions of the denaturation peaks through a bleaching treatment.

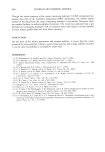
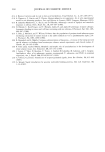
DSC ANALYSIS OF HAIR IN WATER 225 c 4,6 0 ._• 4,4 It: 4,2 4,0 y = 4.55 - 0.069 x r = 0.91 o -' -*--.._ I ................... ,...,.. 0 1 2 3 4 5 6 7 8 Number of Bleachings Figure 4. Plot of/n(HXr•/) vs number of bleachings, according to the assumption of first-order denaturation kinetics. The linear regression line is shown as described by the equation on the graph. In the wet state, furthermore, the increase in the content of anionic groups induces an increase in water content. This leads to a continuous decrease of matrix viscosity and thus of To, in contrast to a less oxidative treatment such as perm-waving, where an expo- nential relationship is observed, as discussed below. In agreement with our results, Leroy et al. (13) observed a decrease in denaturation peak area through bleaching. This can be attributed to a loss of crystalline material, as observed by SAXS (small angle X-ray scattering) (16) or to a general decrease in native o•-helical material, which can be denatured (11). PERM-WAVING EFFECTS Figure 5 summarizes the results for the peak temperature and the denaturation enthalpy for the perm-waved samples in the form of a "box & whisker" plot. Data are given for the start material for this study and the once-bleached material. The latter material, considered as representing an average type of common hair damage, was submitted to the perm-waving treatments. With respect to the scaling of the x-axis of Figure 5, the first number, characterizing a treatment, gives the number of treatments and the second one the duration in minutes. 3 x 30 is thus a sample perm-waved three times for 30 min each. One notes a consistent decrease in T o as well as for AH D with increasing numbers of treatments. This is in agreement with common hairdressers' knowledge, that multiple permanent waving treatments are more effective than a single treatment of equivalent duration.
Purchased for the exclusive use of nofirst nolast (unknown)
From: SCC Media Library & Resource Center (library.scconline.org)