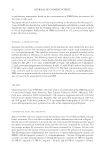
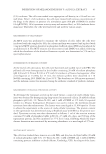
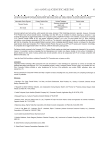
JOURNAL OF COSMETIC SCIENCE 44 was used to determine the protein content with a Bradford assay, using BSA as the stan- dard. The proteins (100 μg) were separated using 10% SDS-polyacrylamide gel electro- phoresis and blotted onto polyvinyl difl uoride (PVDF) membranes (MP Biomedicals Co., Irvine, CA). The membranes were blocked with 5% non-fat skim milk in TBS-T buffer. Tyrosinase and β-actin (as an internal control) were detected using rabbit polyclonal an- tibodies and mouse monoclonal anti-β-actin antibodies, respectively. The membranes were further incubated with horseradish peroxidase-conjugated secondary antibody. All bound antibodies were then detected using an Amersham ECL system (Amersham Phar- macia Biotech, Piscataway, NJ). The signal intensity of each band was quantifi ed with a GS-700 densitometer system (Bio-Rad, CA) equipped with an integrator, and normal- ized with that of the internal control. QUANTITATIVE REAL-TIME REVERSE TRANSCRIPTASE POLYMERASE CHAIN REACTION (qRT-PCR) A quantitative real-time reverse transcriptase polymerase chain reaction (qRT-PCR) was performed on the ABI 7500 Real Time PCR system (Applied Biosystems, Foster City, CA) using Fast SYBR® Green Master Mix (Applied Biosystems). Total RNA was extracted using an RNeasy® mini Kit (Qiagen, CA) according to the manufacturer's instructions. The quality of the total RNA sample was evaluated by determining the OD260/OD280 ratio. To prepare a cDNA pool from each RNA sample, total RNA (2 μg) was reverse transcribed at 42°C for 90 min in the presence of oligo(dT) primers (MD Bio. Co., Taipei, Taiwan) and reverse transcriptase (Roche Molecular Biochemicals, Mannheim, Germany). The oligonucleotide primers for mouse tyrosinase (forward, 5′-GGCCAGCTTTCAG- GCAGAGGT-3′ reverse, 5′-TGGTGCTTCATGGGCAAAATC-3′) and mouse glyc- eraldehyde-3-phosphate dehydrogenase (GAPDH) as an internal control (forward, 5′-ACCACAGTCCATGCCATCAC-3′ reverse, 5′-TCCACCACCCTGTTGCTGTA-3′) were used. After the initial incubation of 2 min at 50°C, the cDNA was denatured at 95°C for 10 min followed by 40 cycles of PCR (95°C, 15 s, 60°C, 60 s). All results were obtained from at least three independent experiments. The mRNA level of tyrosinase was normalized using GAPDH as an internal control. STATISTICAL ANALYSIS All the data in the present study were obtained as averages of experiments that were per- formed in triplicate and are expressed as means ± S.D. Statistical analysis was performed by the Student's t-test. A value of p 0.05 was considered to be statistically signifi cant. RESULTS AND DISCUSSION EFFECT OF PAE ON CELL VIABILITY Safety is an important criterion for a skin-lightening drug. Therefore, before investigat- ing the effect of PAE on the melanogenesis of mouse B16 melanoma cells, the concentra- tion range of the extract that is nontoxic to the cells should be determined. The viability of drug-treated cells was determined by the MTT method. Arbutin was used as the

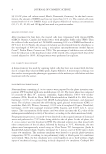
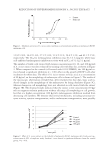
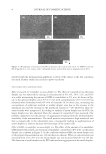
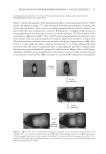
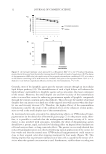
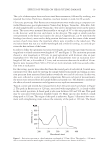
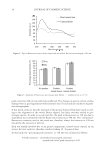
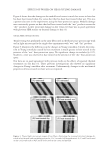
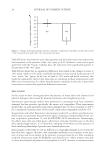
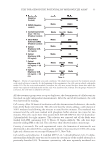
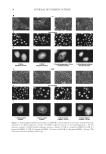
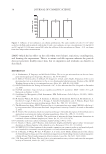
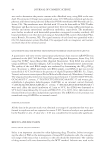
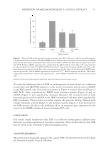
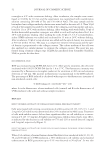
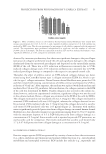
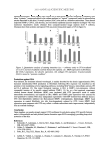
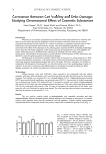
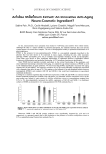
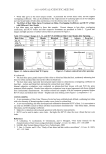
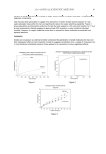
INHIBITION OF MELANOGENESIS BY P. ACIDULA EXTRACT 45 control in the present study. As shown in Figure 1, the result indicated that 50 μg/ml PAE does not exert signifi cant cytotoxicity to mouse B16 melanoma cells. In order to avoid the cytotoxic effect of PAE, we used a PAE concentration of up to 50 μg/ml in the depig- menting experiments of the present study. EFFECT OF PAE ON MELANOGENESIS AND TYROSINASE ACTIVITY IN B16 CELLS To study the anti-melanogenic effect of PAE in B16 cells, the melanin content of the cells in each treatment was determined. The results are presented in Figure 2. The melanin content of B16 cells increased considerably after stimulation by IBMX. Thereafter, PAE Figure 1. Effect of PAE on B16 cell viability. The cells were seeded in 24-well plates for 1 d and then treated with various dosages of PAE (100–3.125 mg/ml) for 2 d. The cell viability was then examined by the MTT assay, as described in the Experimental section. Figure 2. Effect of PAE on melanogenesis in B16 cells. The cells were cultivated for 1 d and then stimulated with 100 μM of IBMX for 2 d in the absence or presence of PAE. The melanin content of the cells was determined using spectrometry, as described in the Experimental section.
Purchased for the exclusive use of nofirst nolast (unknown)
From: SCC Media Library & Resource Center (library.scconline.org)