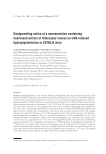
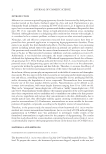
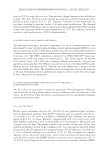
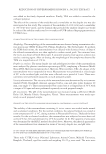
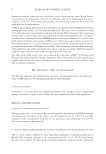
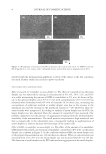
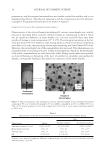
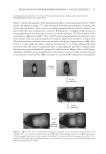
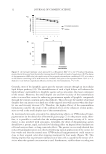
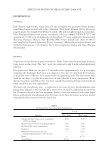
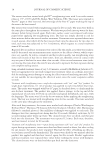
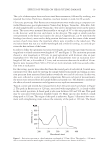
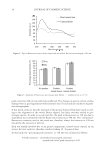
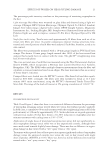
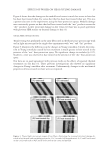
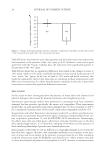
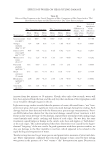
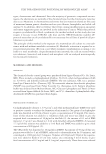
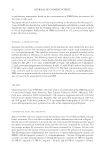
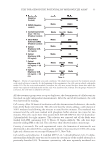
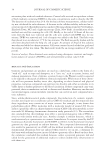
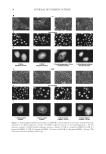
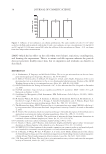
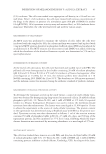
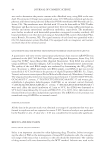
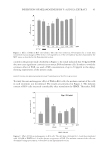
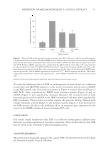
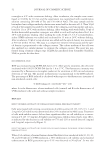
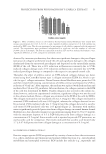
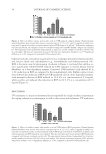
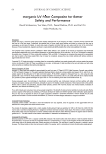
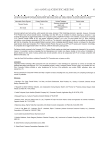
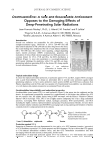
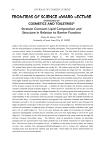
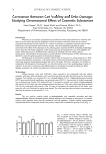
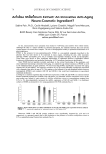
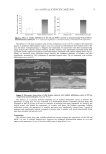
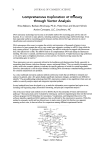
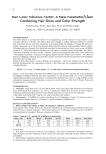
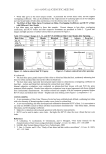
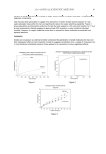
REDUCTION OF HYPERPIGMENTATION BY A. INCISUS EXTRACT 7 12.9 ± 2.9%, 18.4 ± 1.6%, 27.5 ± 3.0%, 51.9 ± 2.1%, 59.6 ± 3.3%, and 62.1 ± 2.5%, respectively. The IC50 for melanogenesis inhibition was 30.2 ± 2.4 μg/ml, while kojic acid exhibited melanogenesis-inhibitory activity with an IC50 of 51.4 ± 5.1 μg/ml. The number of viable cells treated with various concentrations (10, 40, and 100 μg/ml) of A. incisus extract was also evaluated by staining cells with blue dye, as shown in Figure 2. When compared to the control (cell treated with 0.01% DMSO), the 100 μg/ml ex- tract showed a signifi cant inhibitory (p 0.01) effect on the growth of B16F1 cells after incubation for three days. The effect of A. incisus extract or kojic acid, at a concentration of 40 μg/ml, on the morphology of melanocyte cells is shown in Figure 3. The results of the microscopic observations revealed that, after treatment for four days, kojic acid in- duced changes in the morphology of the melanocytes by losing dendrites (Figure 3C), whereas changes in cell morphology were not observed in cells treated with the extract (Figure 3B). The obtained results indicated that the extract at low concentration (40 μg/ ml) can suppress melanin production without affecting cell morphology or cell growth, but that at a higher concentration (100 μg/ml), melanogenesis inhibition resulted from decreasing cell numbers. We theorize that several mechanisms, including tyrosinase en- zyme activity, tyrosine transportation, and/or melanosome transportation, were possibly Figure 1. Inhibitory activities of A. incisus extract and kojic acid on melanin synthesis in melanocyte B16F1 melanoma cells. Figure 2. Effect of A. incisus extract on the viability of melanocyte B16F1 melanoma cells. Each point rep- resents mean ± S.D. of triplicate study. Student’s t-test showed a signifi cant difference from the control group, ** p 0.01.

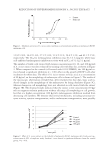
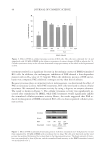
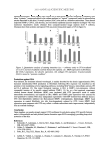
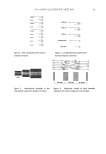
JOURNAL OF COSMETIC SCIENCE 8 involved with the melanogenesis-inhibitory activity of the extract at the low concentra- tion used. Further studies are needed to prove our theory. THE FORMULATED NANOEMULSIONS Effect of ceteareth-10 (emulsifi er) on mean droplet size. The effect of ceteareth-10 on the mean droplet size was observed by varying its concentration of 4%, 8%, 10%, 12%, and 16% w/w while maintaining the amount of GMS (co-emulsifi er) at 5% w/w. As shown in Fig- ure 4, the optimal droplet size of 325 ± 15 nm with a polydispersity of 0.31 ± 0.02 was obtained when formulated with 8% w/w of ceteareth-10. In most cases, increasing the concentration of surfactant resulted in smaller droplet sizes due to the increase in the interfacial area and the decrease in the interfacial tension (17–19). However, these ob- tained results were unexpected. According to analysis of mean droplet size by PCS, the larger droplet size was observed when the amount of ceteareth-10 was increased. One possible explanation was the presence of aggregation resulting from the thermodynamic instability of the nanoemulsions. The small particle size possesses a high interfacial area that is energetically in the suboptimal state, consequently leading to agglomeration of small droplets in order to decrease the free energy of the system (20). Effect of GMS (co-emulsifi er) on mean droplet size. The effect of the amount of co-emulsifi er, GMS mixed with a fi xed concentration of emulsifi er, ceteareth-10 (8% w/w), on the mean droplet size is shown in Figure 5. In the condition without GMS, the mean droplet size of the prepared nanoemulsion was 412 nm (data not shown). When its concentration was increased from 1% to 5% w/w, the mean droplet size was decreased from 413 to 325 nm. The detection of small droplet size by PCS indicated non-aggregation of the small droplets. Figure 3. Morphology of melanocyte B16F1 melanoma cells treated with (A) 0.1% DMSO (control), (B) 40 μg/ml of A. incius extract, and (c) 40 μg/ml of kojic acid for four days (at magnifi cation of 40×).
Purchased for the exclusive use of nofirst nolast (unknown)
From: SCC Media Library & Resource Center (library.scconline.org)