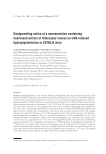
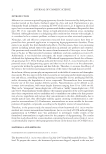
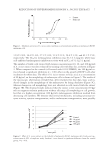
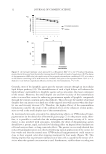
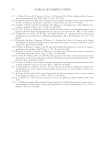
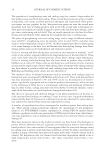
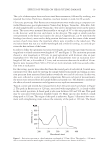
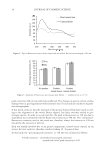
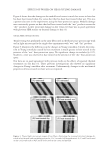
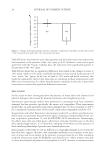
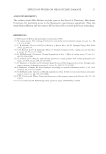
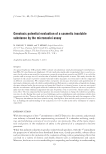
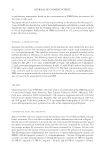
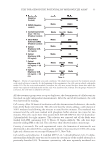
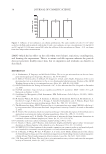
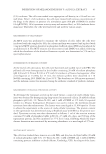
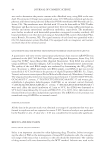
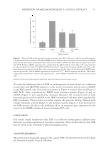
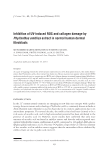
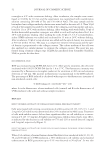
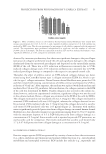
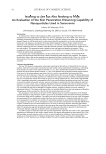
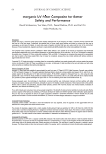
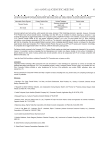
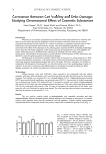
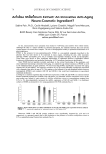
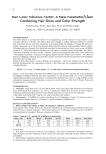
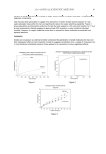
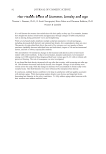
REDUCTION OF HYPERPIGMENTATION BY A. INCISUS EXTRACT 9 In general, GMS at an optimal concentration cannot only decrease the droplet size but also may stabilize the nano-droplet through steric hindrance of the monoester group (21,22) and/or the adsorbed co-emulsifi er layer surrounding the droplet (10). In contrast, when the concentration of GMS was increased (more than 5% w/w), the mean droplet sizes and polydispersity values were obviously increased. The obtained results coincided with those of another study that indicated that increasing the GMS content above 5–10% resulted in larger particles and a broader particle size distribution (23). As GMS is a solid lipid, its high content in the formulation possibly leads to a decrease in homogenization effi ciency and an increase in aggregation of the droplets. From the above-mentioned study, the formulation consisting of 8% w/w ceteareth-10 and 5% w/w GMS provided the smallest droplet size (325 ± 15 nm), with low polydis- persity values (0.31 ± 0.02). This combination was thus selected for nanoemulsion Figure 4. Effect of emulsifi er ceteareth-10 (Brij 56®) concentration on the mean droplet size of the formu- lated nanoemulsions. The concentration of ceteareth-10 varied from 4% to 16% w/w, while that of GMS was fi xed at 5% w/w. Each bar represents mean ± S.D. of three separately prepared batches. Figure 5. Effect of co-emulsifi er GMS concentration on the mean droplet size of the formulated nanoemul- sions. The concentration of GMS varied from 1% to 8% w/w, while that of ceteareth-10 (Brij 56®) was fi xed at 8% w/w. Each bar represents mean ± S.D. of three separately prepared batches.

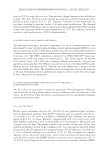
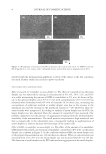
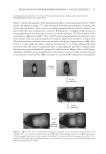
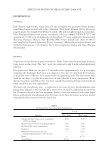
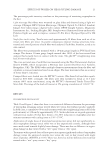
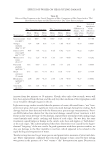
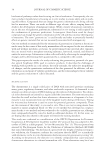
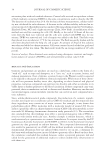
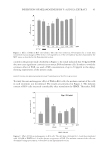
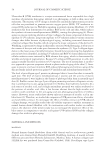
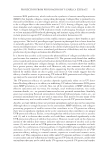
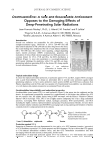
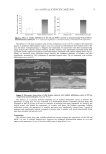
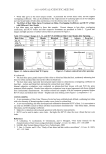
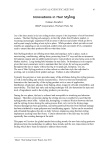
JOURNAL OF COSMETIC SCIENCE 10 preparation, and the prepared nanoemulsion was further studied for stability and in vivo depigmenting effi cacy. The physical appearance and the transmission electron photomi- crograph of the prepared nanoemulsion are shown in Figure 6. STABILITY OF THE SELECTED NANOEMULSION FORMULA Characteristics of the selected formula including pH, viscosity, mean droplet size, and the amount of artocarpin before and after stability testing are summarized in Table I. There was no signifi cant difference in mean droplet size, viscosity, and pH values after three months of storage at room temperature (35° ± 3°C). The artocarpin remaining in the for- mula was about 93% w/w. However, after storing under accelerated conditions, employing seven heat-cool cycles, the percentage of artocarpin remaining was lower (about 86% w/w). Moreover, the mean droplet size of the nanoemulsion was increased. This phenomenon cor- responded with its decreasing viscosity. Unlike microemulsions, which are thermodynam- ically stable, nanoemulsions are only kinetically stable. Being stored under stress possibly accelerated thinning or disruption of the layer of adsorbed co-emulsifi er surrounding the droplet, consequently leading to fl occulation or coalescence of the small droplets. Figure 6. Physical appearance and transmission electron photomicrograph of the nanoemulsion formula consisting of 8% w/w ceteareth-10 (emulsifi er), 5% w/w GMS (co-emulsifi er), 41.6% w/w IPM, 0.05% w/w TEA, 0.03% w/w α-tocopherol, 0.03% w/w carbopol 940, 0.02% w/w A. incisus extract, and water adjusted to 100% w/w. Table I Characteristics of the Selected Nanoemulsion Formula Before and After Stability Testing Characteristic Before After Normal condition Accelerated condition Artocarpin content (% w/w) 0.014 ± 0.007 0.013 ± 0.003 0.012 ± 0.002 Mean droplet size (nm) 325 ± 15 347 ± 19 453 ± 27* Viscosity (cps) 749 ± 17 726 ± 19 673 ± 20* pH 5.52 ± 0.01 5.52 ± 0.01 5.53 ± 0.01 Student’s t-test showed a signifi cant difference of mean droplet size and viscosity between before-and-after stability testing, * p 0.05.
Purchased for the exclusive use of nofirst nolast (unknown)
From: SCC Media Library & Resource Center (library.scconline.org)