JOURNAL OF COSMETIC SCIENCE 394 plants have exhibited antioxidant properties, and they often contain similar, but low, levels of essential oils and therefore antioxidant components. The compositions of the es- sential oils from the same plants may be different due to (i) the age of the plant, (ii) the time of harvesting, and (iii) the extraction methods. Many articles have shown that aging is closely related to the presence of free radicals (7). Free radicals have weak bonds with atoms, molecules, or ions and contain unpaired electrons in the outer shells. Those unpaired electrons try to (and usually do) capture electrons from the nearest stable molecule to gain stability. When the “attacked” mole- cule loses its electron, it becomes a free radical itself, initiating a chain reaction (8,9). Our skin inhibits the pressure of being oxidized from environmental pollution and ultraviolet rays (10) by using antioxidants contained naturally within the body. Many artifi cial anti- oxidants—such as butylated hydroxyanisole (BHA), butylated hydroxytoluene (BHT), tertiary butylhydroquinone (TBHQ), and propylene glycol (PG)—are added to food as well as cosmetics to prevent free radical formation. However, due to safety concerns (11), natural antioxidant alternatives have become more reliable. Natural antioxidants/essen- tial oils such as Cleistocalyx operculatus and Artemisia scoparia have strong DFRS (12,13), while Psammogeton canescens, Pistacia lentiscus, and Myrtus communis extracts contain high levels of phenolic compounds (14,15). The extracts Rosmarinus offi cinalis and Nigella sativa have shown good TEAC capacities (16), whereas the essential oils Ocimum basilicumru and Dorystoechas hastate inhibit linoleic acid peroxidation based on results from the FTC assay (17,18). These examples show that essential oils have favorable antioxidation properties. Previously we studied forty-fi ve essential oils from an Australian company (19,20) and compared their antioxidant activities. In order to explore the sources of essential oils for functional foods, and their applications in cosmetic products, and to investigate their antioxidant activities, DFRS, TPC, TEAC, and FTC assays were employed. Herein we have extended our studies by analyzing the antioxidant activities and the major chemical components of an additional twenty-fi ve essential oils from Ayus GmbH (Baden, Ger- many). MATERIALS AND METHODS MATERIALS Butyl hydroxyl toluene (BHT), 1,1-diphenyl-2-picrylhydrazyl (DPPH), and 3,4,5-trihy- droxybenzoic acid (gallic acid) were purchased from TCI (Shanghai, China). Ammonium thiocyanate (NH4SCN), disodium hydrogenphosphate (Na2HPO4), iron(II) chloride tet- rahydrate (FeCl2 . 4H2O), sodium dihydrogenphosphate (NaH2PO4), and sodium car- bonate (Na2CO3) were purchased from Showa (Tokyo, Japan). Folin-Ciocalteu’s phenol reagent, eugenol, potassium persulfate, and linalool were purchased from Merck (Darm- stadt, Germany). Hydrochloric acid was purchased from MP (Eschwege, Germany). Lino- leic acid, p-cymene, and thymol were purchased from Acros Organics (Geel, Belgium). Trans-cinnamaldehyde was purchased from Alfa Aesar (Karlsruhe, Germany). In addi- tion, 2,2′-azinobis (3-ethylbenzothiazoline-6-sulfonic acid), diammonium salt (ABTS), 6-hydroxy-2,5,7,8-tetramethyl-chroman-2-carboxylic acid (trolox), and carvacrol were purchased from Sigma (St. Louis, MO). The twenty-fi ve essential oils (of 100% purity) were purchased from Ayus GmbH (Baden, Germany). All other chemicals and solvents

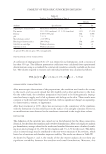
ANTIOXIDANT ACTIVITIES OF ESSENTIAL OILS 395 were of standard analytical grade and purchased from Echo Chemical Co. (Miaoli, Taiwan). GAS CHROMATOGRAPHY-MASS SPECTROMETRY (GC-MS) Analyses of the volatile compounds were tested using a Thermo GC-MS system (GC-MS Trace DSQ-Mass Spectrometer, MSD 201351, Thermo, Minneapolis, MN). An Equi- tyTM-5 capillary column (Supelco, USA) with a 30-m length and a 0.25-mm inside diam- eter was used with a 0.25-μm-thick fi lm. The oven temperature was programmed as follows: isothermal at 40°C, followed by a 5°C temperature ramp every minute to 100°C, which was held for fi ve minutes. Subsequently, the temperature was increased 5°C every minute to 250°C and held for 20 minutes. The carrier gas was helium (1 ml min-1). The injection port’s temperature was 250°C and the detector temperature was 250°C. Ioniza- tion of the sample components was performed in the EI mode (70 eV). The injected vol- ume was 1 μl. The linear retention indices for all compounds were determined by co-injection of the samples with a solution containing a homologous series of C8-C22 n-alkanes (21). The individual components were identifi ed by retention indices and com- parison with compounds known from the literature (22). Their mass spectra were also compared with known, previously obtained, compounds or from the Trace DSQ-MASS spectral database (Thermo, USA). DPPH FREE-RADICAL SCAVENGING ASSAY (DFRS) The antioxidant activities of twenty-fi ve essential oils were assessed by measuring their ability to scavenge the (stable) radical, 1,1-diphenyl-2-picrylhydrazyl. The DPPH assay was performed as described by Gyamfi et al. (23) with the following modifi cations. Two milliliters of test sample in an ethanol solution (1 mg ml−1) was added to 0.5 ml of 2.5 × 10⁻⁴ M DPPH ethanol solution. The reactive mixture and the blank were incubated in the dark at room temperature for 30 minutes. Ethanol (99.9%) was used as the control while BHT was used as the positive control. For each sample, three replicates were re- corded. The disappearance of DPPH was determined spectrophotometrically at 517 nm using a UV-vis spectrophotometer (SP-8001, Metertech Inc., Taipei, Taiwan). Inhibition of the free radical by DPPH as a percent (%) was calculated using the following equation: I % = [1 − (absorbance of sample at 517 nm /absorbance of control at 517 nm)] × 100%. The EC50 values were calculated by linear regression analysis, which was defi ned as the effective concentration of the sample to obtain 50% antioxidant. DETERMINATION OF TOTAL PHENOLIC CONTENT (TPC) The total phenolic content (TPC) was determined by the methods described by Kujala et al. (24) with the following modifi cations. The test samples were diluted to a suitable concentration for analysis. One half a milliliter from the test samples in an ethanol solu- tion (10 mg ml−1), was mixed with 1 ml of 1 N Folin-Ciocalteu’s reagent and 1 ml of 7.5% Na2CO3 (w/v). After three hours of incubation at ambient temperature, the sediment
Purchased for the exclusive use of nofirst nolast (unknown)
From: SCC Media Library & Resource Center (library.scconline.org)