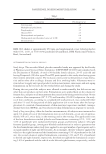
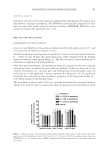
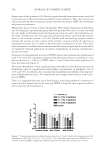
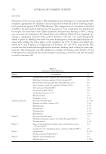
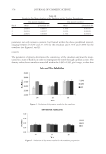
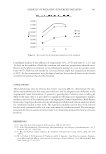
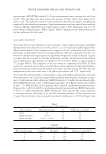
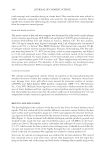
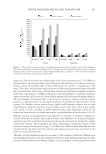
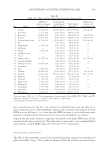
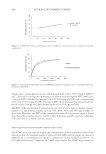
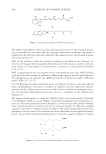
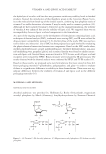
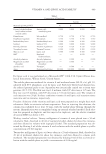
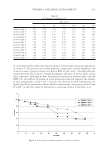
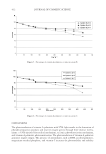
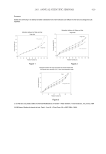
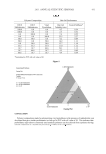
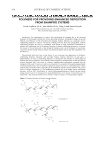
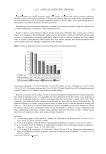
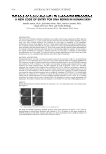
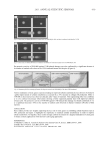
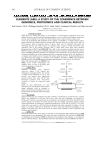
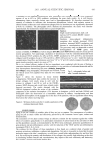
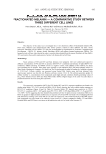
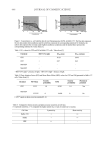
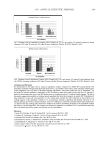
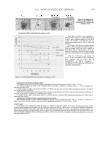
JOURNAL OF COSMETIC SCIENCE 398 summarized in Table II and account for 98.96% of total cinnamon bark extra essential oil. The major component (90.61%) was found to be trans-cinnamaldehyde (Table II), while the four other components were eugenol (2.58%), p-cymene (2.28%) β-caryophyllene (2.10%), and linalool (1.39%), respectively. There are two major chemical components, carvacrol (61.20%) and p-cymene (37.44%) in the essential oil ajowan (representing 98.64% of the oil). The essential oil oregano contains four major chemical components, namely thymol (77.09%), p-cymene (10.01%), linalool (9.59%), and carvacrol (2.06%), which represent 98.75% of the oil. In order to study the antioxidant activities of these major chemical components, these essential oils were purchased in their pure form. DPPH FREE-RADICAL SCAVENGING ACTIVITY The DPPH free-radical scavenging activity data of the twenty-fi ve essential oils are listed in Table III. At a concentration of 1 mg ml−1, the cinnamon bark extra essential oil showed 93.75 ± 0.01% DFRS. This DFRS activity was followed by the essential oils benzoin (90.64 ± 0.01%), nutmeg (86.88 ± 0.01%), spikenard (72.40 ± 0.01%), ajowan (70.30 ± 0.01%) and oregano (59.20 ± 0.01), respectively. The remaining essential oils had apparent DFRS values below 50%. The EC50 value of cinnamon bark extra was 64.31 μg ml−1 (Figure 1), followed by benzoin (292.46 μg ml−1), nutmeg (481.26 μg ml−1), spikenard (540.86 μg ml−1), and ajowan (629.67 μg ml−1). Compared to the positive control BHT, cinnamon bark extra essential oil showed the best DFRS (Figure 2). The EC50 values of the essential oils Cleistocalyx operculatus (12), Artemisia scoparia (13), Satureja cuneifolia (27), and Thymus caramanicus (28) are 807 μg ml−1, 66 μg ml−1, 65 μg ml−1, and 263 μg ml−1, respectively. Therefore, the DFRS of cinnamon bark extra (Cin- namomum verum) is better than that of Cleistocalyx operculatus and Thymus caramanicus and similar to that of Artemisia scoparia and Satureja cuneifolia. Table II Composition of the Essential Oils from Cinnamon Bark Extra, Ajowan, and Oregano Peak area % a Rt Compoundb M. f.c Cinnamon bark extra Ajowan Oregano 10.32 p-Cymene C10H14 2.28 37.44 10.01 12.53 Linalool C10H18O 1.39 9.59 19.96 trans-Cinnamaldehyde C9H8O 90.61 20.92 Carvacrol C10H14O 61.20 2.06 21.29 Thymol C10H14O 77.09 23.35 Eugenol C10H12O2 2.58 25.45 β-Caryophyllene C15H24 2.10 Unknown 1.04 1.36 1.25 a Rt: Retention time (min). b The components were identifi ed by their mass spectra and retention indices (Rls) and by the Wiley and NIST mass spectral databases and previously published Rls. c M. f.: Molecular formula.

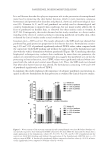
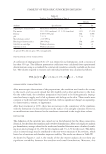
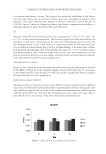
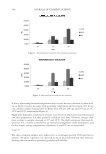
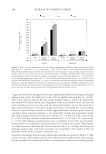
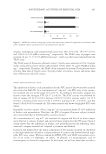
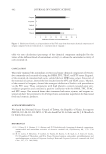
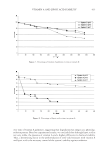
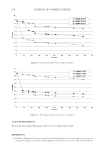
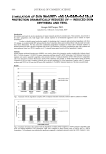
ANTIOXIDANT ACTIVITIES OF ESSENTIAL OILS 399 At a concentration of 1 mg ml−1, the essential oil cinnamon bark extra and three of its main components (trans-cinnamaldehyde, eugenol, and p-cymene) were analyzed for their DFRS activity. In Figure 3, it is clear that the DFRS increases is in the following order: eugenol cinnamon bark extra essential oil trans-cinnamaldehyde p-cymene. Eugenol was the major chemical component attributed to the high DFRS value for the cinnamon bark extra essential oil. The other major components, trans-cinnamaldehyde and p-cymene, yielded DFRS values of 6.01% and 4.55%, respectively. TOTAL PHENOLIC CONTENT (TPC) The TPC of the twenty-fi ve essential oils studied herein were expressed as equivalents of gallic acid (GAE 10 mg−1). The results are shown in Table III, and the essential oils were Table III DFRS, TPC, TEAC, and FTC Assays of the Twenty-Five Essential Oils No. Name DPPH free- radical scavenging activity (%)* Total phenolic content (μg of GAE 10 mg−1)* TEAC (μM of trolox mg−1) Inhibition of linoleic acid peroxidation (%)* 1 Ajowan 70.30 ± 0.01 1845.20 ± 0.04 4374.72 ± 0.01 25.26 ± 0.03 2 Anis extra 4.24 ± 0.01 15.51 ± 0.02 206.83 ± 0.02 — 3 Bay laurel 40.89 ± 0.01 28.23 ± 0.02 204.49 ± 0.01 4.89 ± 0.04 4 Benzoin 90.64 ± 0.01 90.53 ± 0.10 508.89 ± 0.01 18.59 ± 0.03 5 Cinnamon bark extra 93.75 ± 0.01 544.35 ± 0.01 1190.23 ± 0.01 10.46 ± 0.05 6 Fir — 6.39 ± 0.02 88.58 ± 0.01 — 7 Frankincense 1.26 ± 0.01 10.01 ± 0.04 44.09 ± 0.01 — 8 Galbanum — 9.56 ± 0.02 48.78 ± 0.01 — 9 Ginger 4.26 ± 0.01 16.72 ± 0.03 115.51 ± 0.01 — 10 Grapefruit extra — 6.86 ± 0.03 79.22 ± 0.01 — 11 Ho-oil — 4.59 ± 0.01 82.73 ± 0.01 — 12 Jasmine (arab.) 31.93 ± 0.01 47.75 ± 0.04 278.25 ± 0.04 13.70 ± 0.03 13 Lavender Kashmir — 8.03 ± 0.04 121.36 ± 0.01 — 14 Lemongrass extra 16.90 ± 0.01 21.22 ± 0.03 99.12 ± 0.01 — 15 Lemonmint — 8.58 ± 0.01 95.61 ± 0.01 — 16 Litea 3.69 ± 0.01 9.21 ± 0.02 89.75 ± 0.01 — 17 Nutmeg 86.88 ± 0.01 85.24 ± 0.04 363.71 ± 0.01 5.81 ± 0.05 18 Oregano 59.20 ± 0.01 1665.36 ± 0.04 4023.49 ± 0.01 29.17 ± 0.02 19 Palmarosa 5.13 ± 0.01 7.31 ± 0.02 97.95 ± 0.01 — 20 Patchouli 1.39 ± 0.01 22.16 ± 0.01 46.44 ± 0.01 — 21 Pepper extra 6.18 ± 0.01 10.84 ± 0.02 17.17 ± 0.01 — 22 Peppermint 1.79 ± 0.01 13.92 ± 0.01 176.39 ± 0.01 — 23 Sandalwood 1.91 ± 0.01 13.86 ± 0.04 89.75 ± 0.01 — 24 Spikenard 72.40 ± 0.01 58.44 ± 0.08 253.66 ± 0.01 — 25 Wintegreen 4.66 ± 0.01 7.01 ± 0.01 3847.87 ± 0.01 — Values are mean ± S.D. (n = 3). The concentrations of each essential oil for DFRS, TPC, TEAC, and FTC assay were 1 mg ml−1, 10 mg ml−1, 1 mg ml−1, and 1 mg ml−1, respectively. * Antioxidant activity has not been observed.
Purchased for the exclusive use of nofirst nolast (unknown)
From: SCC Media Library & Resource Center (library.scconline.org)