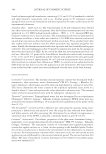
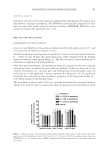
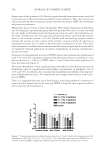
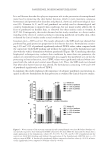
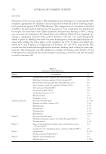
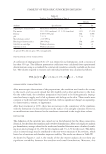
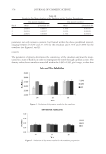
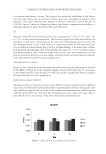
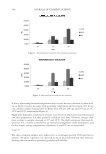
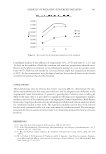
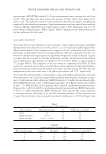
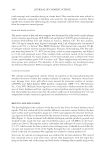
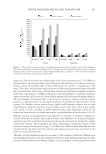
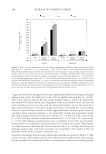
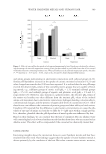
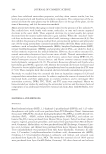
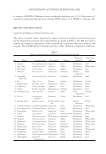
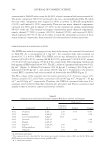
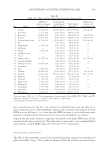
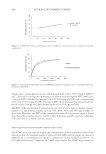
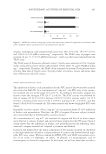
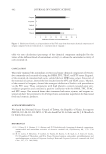
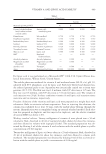
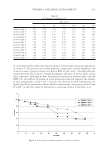
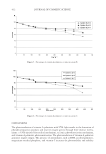
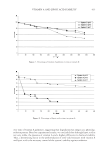
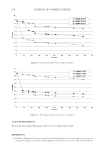
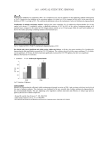
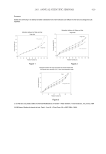
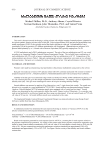
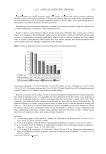
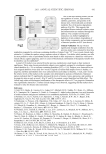
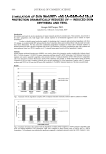
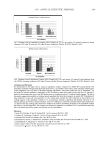
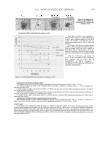
JOURNAL OF COSMETIC SCIENCE 410 Preparation of o/w samples. Around 450 mg of cream was exactly weighed, placed into a 25-ml volumetric fl ask, taken to volume with methanol, and shaken for about fi ve min- utes for vitamin analysis. Approximately 450 mg of cream was exactly weighed and placed into a 25-ml volumetric fl ask, taken to volume with the mobile phase, and shaken for about fi ve minutes for lipoic acid analysis. The solutions were passed through a 0.45- micron membrane fi lter before injection. PHYSICAL STABILITY OF THE SYSTEMS The centrifuge model was performed to study the physical stability of the systems. The centrifuge technique, based on theoretical principles refl ected in the Stokes formula, was used as one of the ways for predicting the vulnerability of the emulsion-to-oil coalescence (18). Centrifugation was performed for 30 minutes at 3500 rpm at room temperature on a Rolco (Argentina) centrifuge. Ten-milliliter samples in graduated centrifuge tubes were used. The classifi cation adopted was: Good: no creaming or phase separation was observed. • Poor: a considerable creaming and/or phase separation was observed. • pH DETERMINATIONS The pH data for all the systems were obtained with model Altronix TPX I (Saen S.R.L., Buenos Aires, Argentina). The pH was measured as directed in USP 31 791, using an indicator glass electrode. The buffer solutions for standardization were from Merck (Darmstadt, Germany) at pH 4.00 and 7.01. RESULTS AND DISCUSSION Based on the results obtained in reference 16, we proposed the second series of emul- sions (Table I) without acetylated lanolin, which was incompatible with lipoic acid (15), and varying the pH. We developed a new base emulsion and prepared the formu- lations from A to D at pH 3, 5, and 7. All the o/w formulations were stable under centrifugation. The pH variations in the period are indicated in Table II generally, the pH decreased. Percentages of vitamin A calculated against time are shown in Figures 4–7 in systems A to D during their storage at ambient temperature. It can be seen that initially the differ- ent batches conform to the regulations laid down by USP 32 /NF 27 (19) with regard to vitamin A content. However, during storage a diminution in mean vitamin A content was observed in the formulations: the lower the pH, the greater the loss. In these systems, the amount of lipoic acid decreased approximately 14% during the prepa- ration of the emulsions, not conforming to the regulations according to USP 32 /NF 27. Lipoic acid could be quantifi ed in system B at initial time and in system A at pH 3 and 5 until 259 days. In the formulations A, C, and D at pH 3 and 5, the loss of content was considerable, reaching 65% for formulation A. During fi fteen months of storage, lipoic acid was quantifi ed with a signifi cant difference in its stability at pH 7 (Figures 8–10).

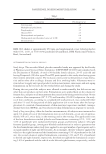
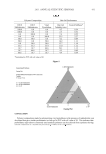
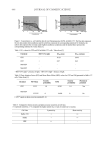
VITAMIN A AND LIPOIC ACID STABILITY 411 It can be deduced from the results that the absence of antioxidants favors the degradation of vitamin A. The presence of ascorbyl palmitate, magnesium ascorbyl phosphate, and vitamin C seem to protect vitamin A as well as BHT at pH 5 and 7. Ascorbyl palmitate (system D) seems less to protect vitamin A palmitate and more to protect lipoic acid in these conditions. Although we have determined an interaction between lipoic acid and BHT (15), the addition of vitamin A in the proportion indicated improves the stability of these preparations at pH 5 and 7. Content was observed in these formulations: the higher the pH, the greater the stability. Based on these results, we propose systems C and D at pH 7 as the most stable for formulations containing vitamin A and lipoic acid. Table II pH Variations in Systems A–D Time (days) 0 43 83 111 195 321 438 System A (pH 3) 3.00 2.98 2.83 2.79 2.79 2.84 2.67 System A (pH 5) 5.00 5.04 4.57 3.84 3.76 3.54 3.34 System A (pH 7) 7.00 7.01 6.83 6.76 6.74 6.63 6.58 System B (pH 3) 3.00 3.08 3.00 2.81 2.89 2.94 2.77 System B (pH 5) 5.00 5.27 5.35 5.30 5.21 5.02 4.91 System B (pH 7) 7.00 6.96 6.89 6.88 6.75 6.60 6.70 System C (pH 3) 3.00 2.96 3.01 2.94 2.99 2.97 2.80 System C (pH 5) 5.00 4.97 5.32 5.25 5.30 5.14 5.18 System C (pH 7) 7.00 6.98 7.02 7.15 7.15 7.08 6.87 System D (pH 3) 3.00 2.98 3.04 2.96 3.03 3.04 2.90 System D (pH 5) 5.00 5.01 5.05 4.92 4.92 4.86 4.76 System D (pH 7) 7.00 6.93 6.84 6.84 6.85 6.83 6.70 Figure 4. Percentage of vitamin A palmitate vs time in system A.
Purchased for the exclusive use of nofirst nolast (unknown)
From: SCC Media Library & Resource Center (library.scconline.org)