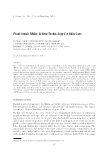
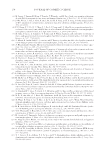
FACILE SYNTHESIS OF TITANIUM PHOSPHATES 151 (Morton, S. 1995–2006, Casa Software Ltd, Teignmouth, UK) with a Lorentzian/Gaussian percentage as 40 and a Shirley background. Fourier-transform infrared (FTIR) data were acquired using Thermo Scientifi c Nicolet iS10 FT-IR spectrometer (Thermo Fisher Sci- entifi c, Waltham, MA). The WR capacities of synth esized pigments were tested by mixing a sample of 1.9 g of pigment material with 0.1 g of urea and 1.3 g of distilled water. The thoroughly mixed paste was spread on a glass plate to make a thin layer, and weight loss was measured using an analytical balance (Precisa XT 220A, Precica Gravimetric AG, Dietikon, Switzerland) at 26°C and at a relative humidity of 57%. The weight loss of the samples was recorded hourly for 7 h. PG-TiO2 (Brand Ti-Pure™, Chemours, Wilmington, DE) and Degusa P25 (Nippon Aerosil Co., Ltd., Tokyo, Japan) were used as the control. Percentage WR was calculated using the following equation: WR% = 0 1 0 t £ ¯² ¦ ¢ ±¦ ¤ »q100 ¦ ¦ ¦ ¦ w w w w where, Figure 1. The fl owchart of TOP and TP preparation process.

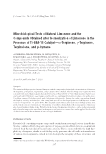
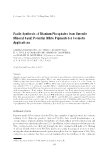
JOURNAL OF COSMETIC SCIENCE 152 w0 = weight of the water, w1 = initial weight of the moist sample with water, and wt = weight of the moist sample at different time intervals (18,19). UV-Vis diffuse refl ectance sp ectra (UV-Vis DRS) of the powder samples of TOP, TP, PG- TiO2, and Degussa P25 were measured using a PerkinElmer Lambda 35 spectrometer (Perkin-Elmer Inc., Waltham, MA). UV-Vis DRS were obtained with 1.25-inch cali- brated certifi ed refl ectance standard (Spectralon Diffuse Refl ectance Standard-99-010) as the background equipped with a 50 mm integrating sphere. The optical absorbance was measured in the 300–900 nm range. The photoactivities of synthe sized TOP and TP were compared with both PG-TiO2 and Degussa P25 by measuring the photoreduction of 2,2-diphenyl-1-picrylhydrazyl radical (DPPH) (20). In a typical experiment, 20 mg of the sample was dispersed in a solution of DPPH (Sigma-Aldrich, Taufkichen, Germany) in a 1:1 mixture 4 3 2 10 mol dm q of mineral oil and caprylic/capric acid triglyceride (Sigma-Aldrich) and irradiated using a 250 W Hg arc Philips UV lamp. Control experiments were performed under dark condi- tion for comparison. Freshly prepared DPPH solutions were used in each experiment. The time dependence of DPPH radical scavenging was tested by withdrawing samples out of the reaction mixture every 10 min and measuring the absorbance at 520 nm (Perkin- Elmer Lambda 35, Perkin-Elmer Inc.). RESULTS AND DISCUSSION CHEMICA L CHARACTERIZATION AND THE MORPHOLOGY OF THE TPS A gradual formation of a gray color mixture was observed as the leaching of ions from ilmenite into H3PO4 solution take place at 150 °C for 5 h. When the mixture was allowed to settle at room temperature, a white precipitate separated from unreacted ilmenite and H3PO4 leachate (Figure 1). The two solid phases can be easily separated with a ~55% yield of the white precipitate. The unreacted ilmenite (~11%) and the H3PO4 liquor can be used for further use. The XRD patterns of the ilmenit e and TOP are shown in Figure 2A and B, respectively (21). Figure 2B confi rms the microstructure of TOP with the chemical formula of Ti(HPO4)2·H2O, (ICDD-01-080-1067) (22,23). The XRD pattern of TP obtained after calcining TOP at 900°C for 4 h is shown in Figure 2C. The conversion of TOP to TP phase was confi rmed by the XRD data. Figure 2C is matched with the XRD pattern of TP with the chemical formula of TiP2O7 (ICDD-01-082-3834) (24). The calcination of TOP to TP proceeds with the removal of water from TOP. The appearance of additional peaks for the TP in the XRD at higher 2θ confi rms the crystallinity of the powdered sample of TP (25). Furthermore, the XRD pattern of ilmenite is signifi cantly different from the XRD patterns of TOP and TP, confi rming the formation of new compounds during the acid digestion. The absence of any XRD peaks corresponding to iron-bearing compounds suggests that both TOP and TP are relatively free from iron. The TEM images of synthesized TPs are shown in Figure 3. The TEM images confi rm the presence of spherical shaped particles for both TOP and TP with an average diameter of 75 and 115 nm, respectively. The EDX analysis data of the prepared TPs are shown in Figure 3. The occurrence of intense peaks corresponding to O, P, and Ti in both EDX spectra confi rms that TOP and TP largely contain phosphate forms of titanium. The presence of a small
Purchased for the exclusive use of nofirst nolast (unknown)
From: SCC Media Library & Resource Center (library.scconline.org)