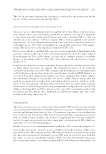
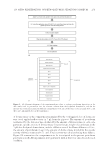
DEAD SEA MUD & CUTANEOUS BLOOD FLOW 263 assigned randomly for mud treatment and the other forearm was untreated. All mud samples were left at room temperature for 24 h before application. Ten milliliter of mud was gently applied using feeding syringe on the assigned forearm and left for 30 min. Then, the mud was gently removed and washed using warm tap wa- ter. The untreated forearm was also washed in a similar fashion to exclude the effect of washing on skin temperature and blood fl ow. Two reading protocols were designed and used to study the effects of tested types of mud on skin blood fl ux and temperature during mud application as well as before and after mud removal. Protocol 1 (Figure 1): laser Doppler readings (Flux and temperature) were taken for areas 1–4 at baseline before mud application and then directly and 15 min after mud removal. A ring of a double-sided tape was applied to hold the laser Doppler probes in place and to allow the removal and reattachment of the probes without applying pressure or other- wise disturbing the microvascular structure under each site. The procedure was simulta- neously performed on the left and right forearms using the dual channel monitor with two probes. Perfusion values for each circular area at the tested time point were measured over 1-min intervals using the manufacturer software, and the mean fl ux and skin temperature for each area at each time point were used for data analysis. Protocol 2 (Figure 2): a ring of a double-sided tape was applied to hold the laser Doppler probes in place on areas numbered 5 on both forearms simultaneously. Baseline readings of the microvascular blood perfusion and skin temperature were performed for areas num- bered 5 for 10 min before mud application (Figure 2) and then 10 ml of mud was gently Fi g ure 2. Protocol 2 laser Doppler probes were fi xed simultaneously on areas 5 on both forearms and base- line readings were recorded over 10 min before mud application and then during the whole mud treatment time for both the treated and untreated forearms.

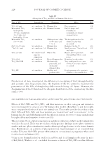
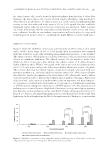
JOURNAL OF COSMETIC SCIENCE 264 applied using feeding syringe on the assigned forearm and readings were recorded during the whole mud treatment time (i.e., 30 min). The mean fl ux and skin temperature for the baseline readings and for the 30 min during mud treatment readings were used for data analysis. DATA ANALYSIS The fl ux and skin temperatures at different time points for each area were summarized as mean ± SEM for both the treated and untreated forearms. The three groups of Dead Sea mud were treated as one group (n = 15) and the statistical analysis was performed using the software Minitab© (LLC, State College, PA). Mu ltiple paired t-tests were used, and its use was justifi ed by the normality test for the differences between the treated and the untreated forearms. Th e paired t-tests were used to compare the fl ux and the temperature measurements’ dif- ference for each area (of the fi ve circular areas) between the treated and untreated fore- arms. No signifi cant differences were found between the treated and untreated forearm measurements for both the fl ux and the temperatures for any of the fi ve circular areas. Fu rthermore, comparison between treated and untreated forearms for each mud type (n = 5) was performed using nonparametric testing, and no signifi cant differences were found for the variable fl ux and temperatures for each mud type. Al l statistical tests were performed with 5% level of signifi cance. RE SULTS AND DISCUSSION Th e chemical analysis results of the Dead Sea mud are presented in Table I. Samples 1–4 are native Dead Sea mud samples that were treated in our laboratories. Samples 1 and 2 were mixed with distilled water and then autoclaved. Samples 3 and 4 were mixed with Dead Sea water and then autoclaved. Samples 5–12 were over-the-shelf Dead Sea mud products available in the Jordanian market. Po tassium levels (%) ranged from 0.23 for RV Body Mud to 0.79 for “As is” mud-1. Calcium contents (%) ranged from 11.59 for BS Mud Mask up to 18.3 for “As is” mud-1. Sodium levels (%) ranged from 0.53 to 1.86. The highest levels were for AT Body Mud and “As is” mud-1 (1.86% and 1.85%, respectively) and the lowest for RV Body Mud. Water-soluble chloride levels (%) ranged from 0.68 to 11.24. The highest levels were for “Salted” mud-1 and 2 (11.1% and 11.24%, respectively) and the lowest level was for RV Facial Mask (0.68%). Manganese levels were below 0.03% for all tested mud samples. Aluminum levels (%) ranged from 0.41 to 0.7 and were highest for BS Mud Mask and lowest for NC Body Mud. Iron (Fe) contents ranged from 0.56% for NC Body Mud to 1.7% for BS Mud Mask. Magnesium levels (%) ranged from 0.82 to 3.57 and were the highest in salted mud samples (3.22% and 3.57%) and lowest for RV Facial Mask (0.82%). Re sults show that “Salted” mud were the richest in magnesium and chloride ions as com- pared with “As is” mud and other processed “Over-the-Shelf” mud. Sodium contents were almost similar between “As is” mud-1 and “Salted” mud-1 and between “As is” mud-2 and “Salted” mud-2. We have noticed that for mud produced from the same company,
Purchased for the exclusive use of nofirst nolast (unknown)
From: SCC Media Library & Resource Center (library.scconline.org)