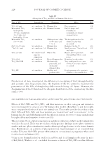
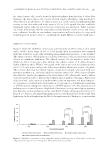
DEAD SEA MUD & CUTANEOUS BLOOD FLOW 265 there were no tangible differences in mineral and salt levels between mud designed for the face and mud designed for the body. Ba sed on their mineralogical contents, we have chosen three muds for the clinical study: “Salted” mud-2, “As is” mud-2, and RV Body Mud (Table 1, gray-shaded rows). The “Salted” mud, “As is” mud and RV Body Mud contain the following amounts (%) of K: 0.59, 0.61, and 0.23 Na: 1.72, 1.85, and 0.53 Cl: 11.24, 8.77, and 0.71 and Mg: 3.22, 2.72, and 0.93, respectively. RV Body Mud contained the lowest levels (%) of K (0.23), Na (0.53), Cl (0.71), and Mg (0.93). Ch anges in mean skin blood fl ow (fl ux) and skin temperature during the different proto- cols for each tested group (n = 5) are presented as mean ± SEM in Figures 3 and 4 and Tables II and III. In addition, changes in mean skin blood fl ow (fl ux) during the different protocols for the three groups of Dead Sea mud combined together (n = 15) are presented in Figure 5. LDF has been in clinical use since 1977 it is characterized by its unique capacity for noninvasive measurement of local cutaneous blood fl ow with its moment-to-moment variability (14). The effect of Dead Sea mud on skin microcirculation according to protocol 1 and 2 is represented in Figures 3–5. Bef ore applying Dead Sea mud, resting skin blood fl ow values and skin temperatures for both treated and untreated (control) forearms were statistically similar. The re were no statistically signifi cant differences between the fl ux of treated forearms directly after mud removal as well as 15 min posttreatment for both “As is” mud and RV Body Mud group compared with the control forearms at each time points as shown in Figure 3A and C. Int erestingly, salted Dead Sea mud group showed slight increase in fl ux directly after mud removal (Δ 1.94), which was maintained 15 min posttreatment (Δ = 2.16) compared Table I C h emical Compositions (%) of Different Dead Sea Mud Samples. Samples 1–4 Were Native Dead Sea Mud Treated at Our Laboratory. Samples 5–12 were “Over-the-Shelf” Mud Bought from the Market. Mud Samples Used in the Clinical Study are in Gray-Shaded Rows Mud K Ca Na Cl Mg Mn Al Fe SO3 SiO2 L.O.I Moisture content 1 “As is” mud-1 0.79 18.3 0.78 9.62 2.96 0.01 0.55 0.66 0.61 19.78 33.55 28.26 2 “As is” mud-2 0.61 16.49 1.85 8.77 2.72 0.03 0.6 0.71 1.08 16.32 45.93 30.05 3 “Salted” mud-1 0.72 17.52 0.84 11.1 3.57 0.02 0.44 0.62 0.52 17.26 35.28 26.64 4 “Salted” mud-2 0.59 14.46 1.72 11.24 3.22 0.03 0.6 0.81 0.3 14.54 50.3 31.77 5 RV Body Mud 0.23 13.27 0.53 0.71 0.93 0.02 0.64 0.77 0.27 25.5 40.51 37.22 6 RV Facial Mask 0.25 13.77 0.56 0.68 0.82 0.02 0.57 0.75 0.1 24.72 40.07 35.49 7 BO Body Mud 0.5 14.05 1.31 7.14 2.22 0.02 0.6 0.77 0.73 14.12 51.58 34.68 8 BS Mud Mask 0.43 11.59 1.15 4.94 1.8 0.03 0.7 1.7 0.39 29.1 34.19 39.73 9 AT Body Mud 0.57 15.71 1.86 4.16 2.97 0.03 0.64 0.8 0.61 15.13 47.57 32.78 10 AT Facial Mask 0.59 15.38 1.76 4.13 2.87 0.03 0.42 0.61 0.68 15.42 47.14 32.07 11 NC Body Mud 0.46 12.59 1.31 3.07 1.86 0.02 0.41 0.56 0.41 19.15 49.94 29.35 12 NC Facial Mask 0.47 12.78 1.25 5.72 1.89 0.02 0.49 0.65 0.84 21.73 45.31 26.64

JOURNAL OF COSMETIC SCIENCE 266 with control forearms at each time points as shown in Figure 3B. However, this slight increase was not statistically signifi cant (p 0.05). The r esults from study protocol 1 were confi rmed by study protocol 2 as shown in Figure 4. In this protocol, the effect of Dead Sea mud on skin microcirculation were monitored during the whole treatment period (i.e., 30 min) by the dual channel LDF for both treated and control forearms, simultaneously. Resti ng skin blood fl ow and skin temperature readings (i.e., baseline) were monitored for 10 min before applying Dead Sea mud and were statistically similar for both treated and untreated (control) forearms. Apply ing Dead Sea mud for 30 min did not result in a statistically signifi cant increase in skin microcirculation for all types of Dead Sea mud compared with control untreated forearm as shown in Figure 4. The s light increase in skin microcirculation for salted Dead Sea mud–treated forearms compared with untreated forearms was also shown in study protocol 2 in which salted Dead Sea mud caused a slight, insignifi cant increase in Flux (Δ 1.28) compared with control untreated forearm as shown in Figure 4B. The ef fect of the three types of Dead Sea mud combined together as one group (n = 15) regardless of their salt content according to both protocols is presented in Figure 5. Fig u re 3. The effect of each type of Dead Sea mud on skin blood fl ow, according to study protocol 1 di- rectly and 15 min after mud removal as compared with untreated control forearm. Mean (n = 5) ± SEM.
Purchased for the exclusive use of nofirst nolast (unknown)
From: SCC Media Library & Resource Center (library.scconline.org)