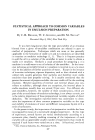
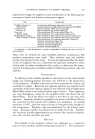
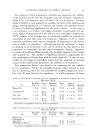
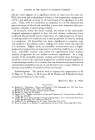
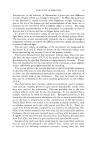
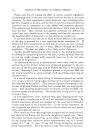
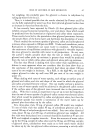
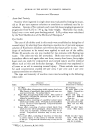
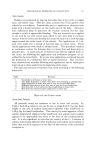
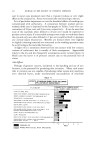
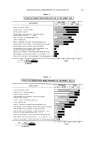
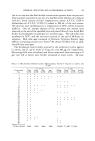
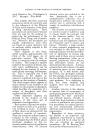
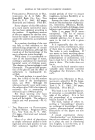
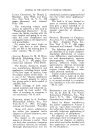
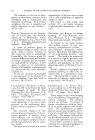
STATISTICAL APPROACH TO COMMON VARIABLES TABLE 4--EMULSION TYPE 90-30 (30 CASES) Frequency of Differences 443 Average Difference between Levels (effects) Emulsifier H•O, Emulsifier Temp., Order of Conc. % Location øC. Addition Agitation 0 0.25 0.50 0.75 1.00 1.25 1.50 1.75 2.00 7 8 3 5 5 5 6 7 6 4 13 10 11 7 13 5 5 4 5 7 7 1 5 7 1 8 12 2 1 TABLE 5--EMULSION TYPE 90-50 (9 CASES) Frequency of Differences Average Difference between Levels Emulsifier H.20, Emulsifier Temp., Order of (effects) Conc. % Location øC. Addition Agitation 0 3 3 1 1 4 0.25 1 1 1 2 0.50 4 4 4 2 2 0.75 1 1 1 1 1.00 5 2 5 1 1.25 2 1,50 2 both o/w and w/o emulsions, however, would be inappropriate. To circumvent this difficulty, the following procedure was used. In the analysis of the factors leading to stable o/w emulsions, the stabilities of the w/o emulsions were designated as zero, regardless of their observed value. Nonmeasurable emulsion types were treated in the same way. In the analysis of w/o emulsions, a value of zero similarly was assigned to the stability of the o/w emulsions formed with the same emulsifier-oil pair. Computations of the differences between the values of the two levels for each of the six factors i.nvestigated were carried out by means of an 'IBM 650 computer. As an example of the differences found between the •two levels, the results pertaining to stability of o/w emulsions after one Iday, for the factor of emulsion concentration, are shown in Table 6. IThe sign of the difference values indicates which level of the factor under study may have significance. Thus a positive value means that a 2.5 per •cent level of emulsifier favors the formation of a stable o/w emulsion, •whereas a negative value indicates that 1 per cent emulsifier favors a stable o/w emulsion.

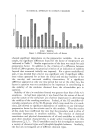
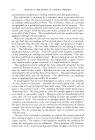
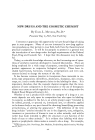
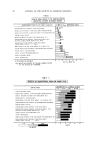
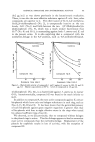
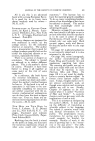
444 JOURNAL OF THE SOCIETY OF COSMETIC CHEMISTS TabLE 6--EsluLSXrtER CONC•N•:R.•:toN•ON• D.•¾ Sx.•m•n:¾ oF o/w Esltr•s•oNs Average Value of Stability Differences of 1% and 2.5% Emulsifier (90-30 groups) Mineral Cottonseed Oleic Methyl Phenyl Emulsifier Oil Oil Acid Silicone G-263 1.25 1.25 2.25 - 0.50 IPADBS 2.25 2.00 1.25 1.25 G-2159 2.25 2.25 1.25 0 Brij 35 2.25 1.00 0.50 0.25 Tween 60 1.25 2.25 1.75 --0.25 Tween 80 1.25 2.25 2.00 --0.25 Renex 678 0.25 1.00 2.25 --0.25 Myrj 45 4.00 3.00 --0.50 2.75 Tween 81 0.75 2.50 --0.75 0 Span 20 1.25 1.50 2.50 0.75 Span 60 4.25 2.00 2.25 2.25 Span 80 2.00 1.25 2.25 1.25 Span 85 1.00 1.00 --0.50 1.00 + means 2.5% is favored for a stable o/w emulsion. .-- means 1% is favored for a stable o/w emulsion. In order to determine the magnitude of difference values which arel significant, the frequency of these differences were tabulated. Results l of the differences between levels for all factors for initial stability arel recorded in Fig. 1. Inspection of this plot indicates a distribution of small' difference values about zero. These observed deviations evidently repre-I sent normal experimental variation and are considered to be withouri significance. A high concentration appears at difference values of 2.00- 2.25, followed by lower frequencies for still higher differences. Similar results were obtained in the plot of stability differences at one day and one week. An alternative approach to the limit of difference which is significant involves the following considerations. It is believed that one unit on the stability scale is the maximum error which is to be expected. To evaluate one variable for an emulsifier-oil pair, the four stability results for one level are subtracted from the four stability results at the alternative level, and the difference is averaged by dividing by four. Should all four stability results at one level deviate by one in the same direction and all four results at the other level deviate by one in the opposite direction, the averaged difference would be given by: (+l+l+l+l) - (-i-I-I-' 1) = 2.00 4 Thus the largest variation that would be expected from variations in sta- bility observation is 2.00. Significant deviations from zero are conserva-I tively estimated, therefore, to begin at a difference of 2.00, both on the, basis of the observed distributions of differences and the maximum expectedl errors in stability ratings. On the basis of this criterion, less than half of the systems evaluated'
Purchased for the exclusive use of nofirst nolast (unknown)
From: SCC Media Library & Resource Center (library.scconline.org)