RHEOLOGY OF STRATUM CORNEUM--I ledge of the thickness of the stratum corneum. Microscopic measurement of frozen transverse sections from several pigs' ears gave an average value of the thickness of 15 x 10 -6 m and this has been used throughout in the modulus calculations. Even along a single section the variation in thickness values obtained was extremely large, ranging from 8-25 x lff 6 m and as it was not known whether this represented the true variation in corneum thickness or was simply due to poor sectioning, an average value was undoubtedly the best estimate. Direct measurement of the thickness of excised corneum by means of a micrometer gauge could not be made due to inhomogeneities in the form of small hairs, patches of lower epidermis (Malpighian layer) which adhered tightly to the corneum undersurface, and the variously wrinkled nature of the dried corneum sheet. An Instron tensile tester fitted with the lowest load cell (the A cell) operating at high sensitivity (load range 2-40 g) was used to obtain elastic moduli. The extension rate was usually about 10•o min -• except for very low modulus samples which required higher rates (never greater than 50•o min4). An environmental chamber in the form of a Perspex box surrounded the corneum sample, and Instron clamps and temperature and humidity within the box were controlled with a Vapor-temp apparatus (Blue M Electric Co.). Accurate measurements of temperature and relative humidity (rh) were made with a wet and dry bulb thermometer arrangement situated close to the sample within the box. Throughout this work the temperature was 25 4- 0.5 ø and relative humidities were accurate to 4- 2•o. A relative humidity run involved the determination of the elastic modulus of a single corneum sample at a number of relative humidities in the range 30-100•o. During a run the rh was always increased and an equilibration time of 20 min was allowed at each rh. Measurements of elastic modulus as a function of time at particular rh values indicated that 20 min was more than long enough for samples to equilibrate. The method by which Instron load cells measure load involves a certain amount of yield in the interior of the cells. In the case of the A load cell, the yield (extension or deflection coefficient) is quoted as 2.54 x 10 -6 mg 4 (Instron, Maintenance Manual, 1). The extension obtained from the Instron chart is therefore a composite of that of the sample plus the load cell yield (2.54 x number of g load x 10 -6 m in this case) and the appro- priate subtraction must be made to find the sample extension. The nature of this correction is such that its significance depends on sample length for a material of a particular modulus. Longer samples will show greater exten- sions on application of the same load and a length will be reached at which the yield correction is negligible. This critical length for stratum corneum

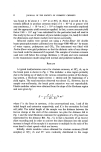
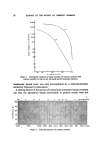
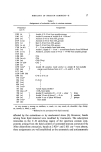
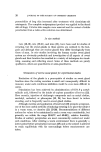
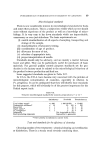
JOURNAL OF THE SOCIETY OF COSMETIC CHEMISTS was found to be'•about 4 x 10 -3 m at 30•o rh. Since it proved to be ex- tremely difficult to produce corneum strips of 4 x 10 -3 m or greater with any consistency, 1 x lff • m to 2 x 10 -• m lengths were normally employed and the appropriate yield correction applied. In fact, a more accurate yield factor 2.40 x 10 -6 mg 4 was calculated for the particular load cell used in this study by the use of whiskers of pure metals (copper, tin, lead) for which the dimensions and elastic moduli were known accurately. Infra-red studies were carried out using a Perkin-Elmer 225 double beam spectrophotometer calibrated over the range 4 000-400 cm -• by means of water vapour, polystyrene and CO•.. The instrument was fitted with Perkin-Elmer wire grid polarizers so that the dichroic ratio of any absorp- tion band could be measured if required. The samples of stratum corneum used were well below the average thickness (10 I•m) and were examined in the transmission mode using both normal and polarized radiation. RESULTS A typical load/extension curve for stratum corneum, at 30•o rh, up to the break point is shown in Fig. 1. This includes: a shoe region probably due to the taking up of slack in the various connection points of the clamp- ing system, a Hookean region (stress •c strain) and the beginnings of a yield region. The total extension observed was about 1 •o. However, due to sample non-uniformity, the break point extension was not reproducible. Elastic modulus values were obtained from the slope of the Hookean region and were given by: Fx1 E = N m -• A x (dl-K) where F is the force in newtons, A the cross-sectional area, 1 and dl the initial length and extension respectively, and K is the correction for load cell yield. The initial length of the sample was the distance between the Instron clamps at the start of the extension run plus the distance AB in Fig. 1 and the total Hookean extension for application of a 20 g load was represented by the distance BD. Fig. 1 is in fact a facsimile of an Instron chart recording and in order to convert the chart distances into the actual increase in length of the sample it is necessary to multiply by the ratio of the cross head to chart speeds which are known. Initially, elastic modulus values obtained for stratum corneum (50-60 samples) at 30•o rh and 25 ø were randomly distributed in the range
Purchased for the exclusive use of nofirst nolast (unknown)
From: SCC Media Library & Resource Center (library.scconline.org)