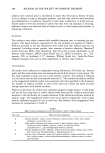
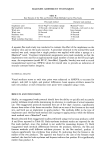
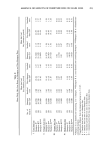
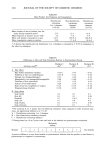
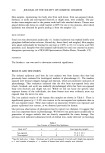
190 JOURNAL OF THE SOCIETY OF COSMETIC CHEMISTS Table III Comparison of Visual (Mildness) Results Obtained When Two Personal Cleansing (Soap) Bars Were Tested in 5-Day Exaggerated-Use and 4-Week Home-Use Studies Home-use test Flex Forearm wash test test Forearms Legs Test product Erythema Erythema Dryness Erythema Dryness Erythema Dryness A 0.77 1.61 1.76 0.96 1.17 0.94 2.43 B 2.45 0.76 1.09 0.85 1.07 0.82 2.47 p-value 0.0001 0.0001 0.0001 0.24 0.37 0.1 ! 0.05 Values reported are mean endpoint attribute scores differences are considered significant if p • 0.05. While these findings are useful from developmental and marketing standpoints, they do not answer the question of how mild the products will be under conditions of actual consumer use. Insight into the question is provided by data generated in a home-use study (Table III). Because this is an ad lib study, the differences observed are not as great as those in the exaggerated studies, and in only one instance is a significant difference found between the products. However, there is a clear trend in the data indicating that product B is milder than product A. This ranking is consistent with the ranking predicted by the forearm wash method, opposite that predicted by the flex wash method. To determine whether the contradictory mildness picture yielded by the flex and forearm wash methods was due to product composition (bars A and B both contain a high percentage of soap), the exaggerated wash procedures were repeated using two synthetic detergent (syndet) bars, coded C and D. The results of these studies, along with results generated in a 12 week home-use study, are reported in Table IV. The home-use results show product C to be milder than product D. Both exaggerated methods show a similar mildness trend, although the flex test fails to find a significant mildness difference between the products. During the performance of the flex studies, subjects developed a noticeable abrasion at the wash sites. This abrasion is atypical of normal use, and was not observed in any of the subjects participating in the forearm wash studies. As noted earlier, one of the Table IV Comparison of Visual (Mildness) Results Obtained When Two Personal Cleansing (Syndet) Bars Were Tested in 5-Day Exaggerated-Use and 12-Week Home-Use Studies Home-use test Flex Forearm wash test test Forearms Legs Test product Erythema Erythema Dryness Erythema Dryness Erythema Dryness C 0.52 1.27 1.11 0.28 0.76 0.45 2.16 D 0.56 1.82 1.61 0.31 0.98 0.70 2.70 p-value -NS- 0.0001 0.0001 -NS- 0.031 0.016 0.003 Values reported are mean endpoint attribute scores differences are considered significant if p • 0.05. P-values •0.5 are indicated by -NS-.

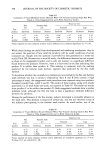
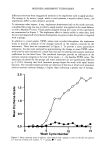
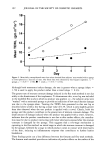
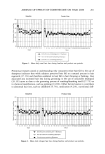
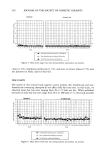
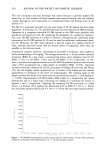
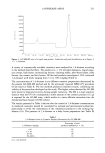
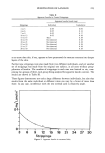
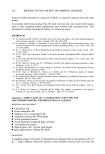
MILDNESS ASSESSMENT TECHNIQUES 191 differences between these exaggerated methods is the implement used to apply product. The sponge is, by nature, rough, while a towel presents a smooth surface hence, the implements differ in their abrasive potential. To determine what impact, if any, implement abrasiveness had on the study outcome, a modified flex study was run in which a single product was applied in the usual fashion, or with a Masslinn © towel. Visual grades assigned during the course of this experiment are summarized in Figure 1. The implement effect is clearly visible in these data both the rate and magnitude of erythema development are greater when the product is applied with a sponge. In addition to visual grades, TEWL values were recorded throughout the implement study to provide a measure of the damage induced in the stratum corneum by the treatments. These data are summarized in Figure 2. To provide a more quantitative evaluation, the data were analyzed by approximating the change in mean TEWL value, with time for each treatment as a linear function and calculating least-squares regression coefficients for the fitted lines. The calculated intercepts provide an indication of the stratum corneum integrity at the start of the study, i.e., the baseline TEWL value. The intercepts calculated for the sponge and towel treatments are not significantly different (p • 0.05), showing that both treatment groups began the study with equal barrier function. The calculated slopes provide an indication of the rate at which each treatment induces stratum corneum damage, a higher slope indicating a greater rate of damage. 2.0 I 1.5- 1.0- 0.5- 0.0 0 5 10 15 Wash Cycle Number Figure 1. Mean erythema scores of subjects' arms washed with a sponge or towel in the flex test plotted as a function of wash cycle number. O = sponge O = towel.
Purchased for the exclusive use of nofirst nolast (unknown)
From: SCC Media Library & Resource Center (library.scconline.org)