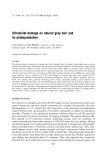
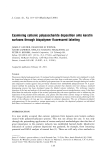
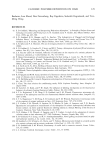
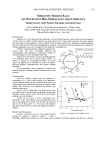
IN VIVO CONFOCAL MICROSCOPY 93 scalmer piezo driver• objective lens • contact device•T• contact device skin Figure 1. Schema of the in vivo confocal module. Rapid Z-scan piezo objective driver and contact device. availability of memory space (RAM) in the workstation, but was typically about ten seconds for standard size images (512 x 480 pixels) at video-image rates. The control electronics regulated the position of the piezo driver through the piezo control by synchronizing the driver with the timing of the video stream. Thus, the acquisition of depth series (Z-series) or time series (t-series) was done at intervals fast enough to avoid severe shifts between the optical sections. The resulting image stack (data sections) could then be processed in a few minutes for volume rendering and thickness measurements of the various epidermal layers (10). Z-series formed of 80 optical sections separated by 1-pm steps were acquired on the forearm. The stacks were processed with the OTIP3D software (LISA Labs, CPE, Lyon, France), using first the wavelets algorithm (11) for noise reduction and then the region- growing algorithm (12) for the binarization of convex features. The 3D reconstruction could easily be examined from any view angle with the volume-rotating capability of the software. SUN EXPOSURE EXPERIMENT Two volunteers spent one week on a Caribbean beach, free of any experimental con- straints. Subject A was a 32-year-old male, having skin phototype III according to the classification of Fitzpatrick (13). Subject B was a 30-year-old female, having skin pho- totype IIi. In vivo confocal images of the dorsal forearm of each subject were recorded using the blue laser line before exposure (TO), two days after the ten-day trip (T12), ten days (T20) and 30 days (T40). The stratum corneum thickness was automatically mea- sured by using the OTIP3D software from six stacks of optical sections per time-set. RESULTS REFLECTION IMAGES OF THE EPIDERMIS Keratinocytes of the spinous layers of the epidermis were identified by their dark nuclei

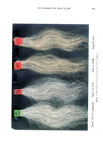
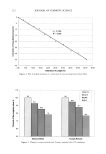
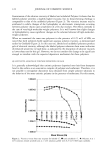
94 JOURNAL OF COSMETIC SCIENCE (Figure 2a). The cytoplasm exhibited varying bright features corresponding to cytoplas.rn organelles and/or melanin granules. The plasma membrane was clearly defined. Near the dertoo-epidermal junction, a monolayer of bright basal cells (Figure 2b) surrounded the derreal papillae in clusters arranged in the shape of bouquets at the top. At deeper levels these clusters appeared as crowns. In the center of the derreal papillae, dark rounded areas (not shown) indicated the presence of capillary loops where the flow of red blood cells and leukocytes could be watched in movement as a series of time frames. The 3D reconstruction of a volume of living skin permitted an observation of the relationships between the various segmented features: the keratinocytes identified by their nuclei (Figure 3a), the stratum corneum as an overlay (Figure 3b), and the derreal tissue on the ground. This mode of representation demonstrates that thickness mea- surements can be automatically extracted from the whole field of exploration, thus ensuring good accuracy of the results. The 3D reconstruction of the bright features in the basal cells layering a derreal papilla is shown in Figure 4a. By zooming and rotating one of the segmented features (Figure 4b), its lower side clearly revealed a non-convex hull that could be easily associated with the imprint of the nucleus. Thus, the shape and size of this non-convex volume could be attributed to the melanin cap covering the apical pole of the nucleus. SUN EXPOSURE The evolution of the stratum corneum thickness followed the same pattern for the two subjects even though individual variations could be recorded (Figure 5). There was a 25% increase at T12 for each subject, which was confirmed at T20. A decrease at T40 was more pronounced for subject B, which recovered almost its initial value. Unusual histologic changes occurred within the whole epidermis after exposure. First, bright inclusions inside numerous nuclei of granular and spinous keratinocytes (Figure Figure 2. Horizontal optical sections of epidermal layers. (a) A section 36 t•m below the skin surface of a Caucasian skin sample. Each keratinocyte contains a dark nucleus, bright features, in the cytoplasm enclosed in the plasma membrane 488-nm blue laser line. Image size: 180 x 168 i•m. (b) A section 48 lam below the skin surface of a Negroid skin sample showing three dermal papillae delineated with bright basal cells forming bouquets and crown 488-nm blue laser line. Image size: 180 x 168 tma.
Purchased for the exclusive use of nofirst nolast (unknown)
From: SCC Media Library & Resource Center (library.scconline.org)