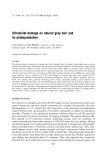
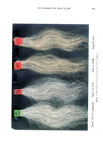
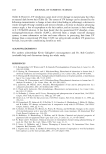
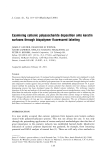
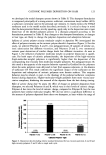
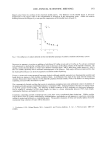
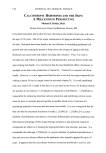
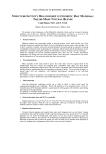
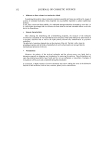
IN VIVO CONFOCAL MICROSCOPY 95 Figure 3. 3D reconstruction of the epidermis from a stack of 66 optical sections, l-Fro steps. The segmented features correspond to: (a) The dermo-epidermal junction in grey tone and the nuclei of spinous and granular keratinocytes in white. The basal epidermal layer is not represented. (b) The stratum corneum represented as a semitransparent light-grey overlay. 6a) persisted up to T20 while almost disappearing at T40. The zoomed image (Figure 6b) clearly shows the shape and size of four inclusions within a dark nucleus. Second, brightly spotted filaments running between keratinocytes were observed at T12 and T20. They had a preferential vertical orientation within the epidermis and seemed to follow the intercellular route (Figures 7a and 7b). Third, melanin caps observed at TO (Figure 8a) were no longer detected at the site of the usual bright basal monolayer (Figure 8b). This lack of melanin persisted until T20. They could still be observed at T40. DISCUSSION This new prototype of CLSM dedicated to in vivo skin exploration brought substantial improvements compared with previous systems (6-8). Sharper images of the epidermal keratinocytes could be recorded with the blue laser line (Figure 2a). This could be ..• . , . ._ . .,.•.: .... • • ... . . . ..... "5' - ß, ..... '• " •--• ß •j:• •' .","i•' .... '. ..... ' '•-. ..... 7- " ""• "• :'• a b Figure 4. 3D reconstruction of the segmented bright features into the basal keratinocytes. (a) Overview of the bouquet overlaying a dermal papilla. (b) Detail of one feature zoomed and rotated in order to reveal the spherical imprint of the nucleus.

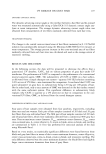
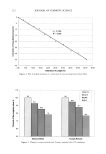
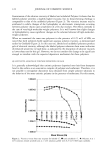
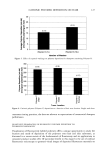
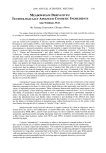
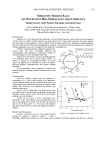
96 JOURNAL OF COSMETIC SCIENCE • 20 --D-B 10 ........................ 0 10 20 30 40 50 Days Figure 5. Sun exposure: evolution of the stratum corneum thickness following one-week sun exposure in subjects A and B. anticipated since the Raleigh-limit formula predicts better resolution for shorter wave- lengths. Nevertheless, other technical features could also be responsible for the unprec- edented quality of the images. The use of a coherent light instead of white light can be considered, even though it has already been demonstrated that the laser source used generates side lobe effects (14) that may degrade resolution. This effect is not encoun- tered with incoherent white light sources. The rather unusual high numerical aperture .. .... ... ...•. ß . ... Figure 6. Sun exposure: condensation of the chromatin. (a) Presence of bright inclusions in numerous nuclei of granular and spinous keratinocytes subject B, T20. Image size: 168 x 168 pro. (b) Zoomed image of four nuclei showing several bright inclusions in each subject B, T12. Image size: 42 x 42 pm.
Purchased for the exclusive use of nofirst nolast (unknown)
From: SCC Media Library & Resource Center (library.scconline.org)