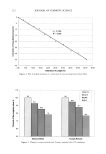
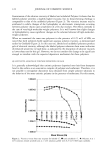
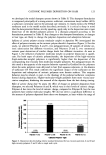
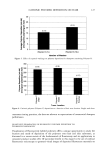
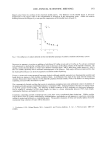
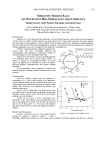
CATIONIC POLYMER DEPOSITION ON HAIR 127 30 25 • E• 20 E• 10 o• 5 ,• o (0.11) (0.17) Polymer B (lx) Polymer B (10x) Number of Washes Figure 5. Effect of repeated washings on polymer deposition fbr shampoos containing Polymer B. 350 300 '2oo-- E E100 •[ 50 Q. ß o (0.38) (0.28) (0.37) Tress Location Figure 6. Cationic polymer (Polymer C) deposition as a function of hair tress location. Single wash data. consumer rinsing practices, the data are relevant to expectations of commercial shampoo performance. QUALITATIVE EXAMINATION OF FLUORESCENT POLYMER DEPOSITION VIA FLUORESCENT MICROSCOPY Visualization of fluorescently labeled polymers offers a unique opportunity to study the location and mode of deposition of the polymers onto hair and skin substrates, as discussed in a recent review of the fundamentals of fluorimetry and its applications to consumer product studies (20). Of particular benefit in this regard is the use of confocal fluorescence microscopy to generate visual images of deposited fluorescent materials on

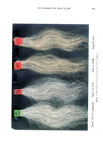
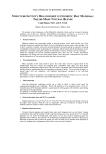
128 JOURNAL OF COSMETIC SCIENCE hair and skin. The principles of confocal microscopy and its use in personal care have recently been reviewed (21). We examined various polymer-treated hair fibers via confocal microscopy to gain further insight to the mode of deposition of the polymers onto the surface of hair fibers. The photomicrograph presented in Figure 7a shows an untreated virgin blond hair fiber under typical fluorescent viewing conditions. Note that hair has a natural fluorescence. Images presented in Figures 7b and 7c display individual fibers taken from tresses treated with shampoos containing Polymer A and Polymer C, respectively. The fluo- rescently labeled polymer deposited on the hair is easily detected. Qualitatively, the fluorescence intensity of a hair sample treated with a shampoo containing the high- viscosity polymer is much stronger than that of a hair sample treated with the low- viscosity polymer shampoo formulation, in agreement with the quantitative data dis- cussed above. The appearance of patches of strong fluorescence and areas of weak fluorescence intensity (Figures 7b and 7c) suggests that the polymer is not deposited uniformly on the tress. The highly fluorescent clusters may be regions of stronger deposition of polymer/ surfactant complexes, although this cannot be proven by the use of this technique. Interestingly, recent fluorescent images of hair treated with an SLES surfactant system containing a protein labeled with a comparable dye show similar patchiness (9). The authors of the study propose that the images reflect the preferred deposition of the protein on sites of damage on the hair. Our results suggest that this phenomenon may not be limited to proteins, but that cationic cellulose ethers may also show preferential adsorption to specific hair sites. A corollary to this observation is that caution should be placed in attempting to quantify polymer deposition by single-fiber analysis. Measure- ments using fluorescence imaging alone are prone to significant sources of error and artifact. The bulk hair digestion protocol and the quantitative fluorescence spectroscopic analysis of the digest described in this article circumvent some of these uncertainties. It offers an easy and reproducible means of comparing the adsorption properties of a wide range of synthetic and natural polymers in "real" situations. ACKNOWLEDGMENTS The authors would like to recognize the help provided in these studies by Carmella ,:. 4• .• .... .• :?:i._•--• • " -3A / 06:04:98 / 20x / 40 •:•0•.3C / 0•:27:•S / 10x / a0 -•. Figure 7. Confocal laser fluorescent photomicrographs of (a) normal virgin blond hair, (b) virgin blond hair treated with a single wash with Polymer A, and (c) virgin blond hair treated with a single wash with Polymer C.
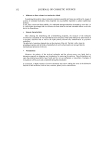
Purchased for the exclusive use of nofirst nolast (unknown)
From: SCC Media Library & Resource Center (library.scconline.org)