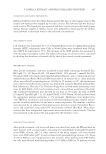
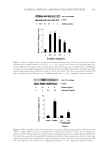
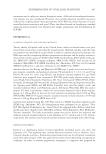
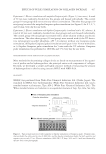
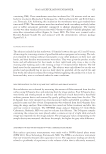
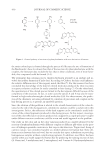
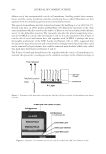
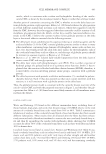
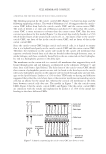
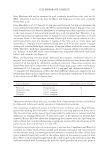
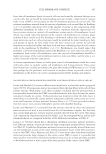
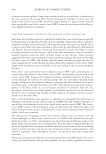
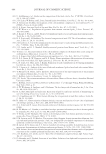
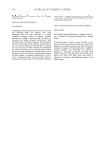
DETERMINATION OF TOTAL LEAD IN LIPSTICK 409 lipstick samples and no variation in ICP–MS values for lipstick portion sizes ranging from 0.1 to 0.4 g (see Figure 1). The fi nal method parameters are outlined in Table II. For each lipstick sample, duplicate portions and portions fortifi ed at 0.5 and 1.0 μg Pb/g were digested. A Pb solution in 1% HNO3 was used for fortifi cation. Each digestion batch of 12 vessels also included a blank, a blank + 0.02 μg Pb/g, an organic Pb RM (0.100 μg Pb/g in base oil 20), and an RM with mineral content (estuarine stediment, SRM 1646a). RESULTS METHOD VALIDATION Accuracy of the method was demonstrated by measuring recoveries of Pb from RMs and from fortifi ed lipstick samples. Since no lipstick-type RM was available, several RMs were analyzed representing varying matrix types. NIST 1635 trace elements in coal (complex matrix, organics) NIST 8435 whole milk powder (high fat matrix) NIST 1084a wear metals in oil and SPEX ORG-PB8-2Y/Z lead in base oil 20 (oily matrices Figure 1. Portion size effect before and after adding excess boric acid. Table II Final Method Parameters ● 0.3-g lipstick portion ● 2 ml HF + 7 ml HNO3 ● CEM XP-1500+ vessels, MARS Microwave Digestion System ● Heat in two steps to 200°C, hold for 30 min: Stage Power (watts) Ramp (min) Pressure (psi) Temperature (°C) Hold (min) 1 1200 15:00 0800 130 3:00 2 1200 15:00 0800 200 30:00 ● Cool to 50°C, vent, add 30 ml 4% boric acid ● Heat to 180°C, hold for 10 min ● Dilute to 200 ml

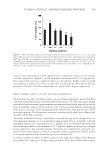
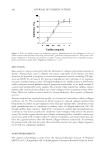
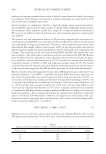
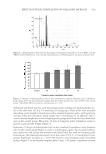
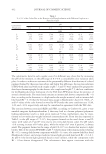
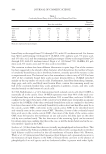
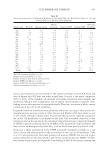
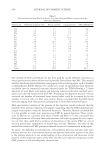
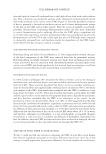
JOURNAL OF COSMETIC SCIENCE 410 containing organically complexed Pb) and NIST 1646a estuarine sediment (refractory mineral matrix). Pb recoveries from RMs with and without HF are shown in Table III. Complete recovery of Pb from the RMs was obtained by simple HNO3 digestion, with the exception of estuarine sediment, for which complete recovery was obtained only when HF was used in the digestion. Each lipstick sample was fortifi ed at two levels and analyzed following HNO3/HF digestion, with recoveries averaging 98.1%. Absence of matrix infl u- ence was shown by sequentially diluting several analytical solutions, with no signifi cant differences. Analytical solution stability was demonstrated by analysis of three representative analytical solutions over time. Two analytical solutions containing approximately 0.25 and 1.0 μg Pb/l were analyzed on days 1, 3, 7, and 14 using freshly prepared standard solutions on each day. There was 5% variation over the time period. A 10-μg Pb/l standard solution prepared on day 1 and analyzed with the analytical solutions on subsequent days behaved similarly. Method precision was demonstrated by between-day and within-day repeatability experiments. A 3% relative percent difference (RPD) was observed from analyzing 22 portions of lipstick composite over three days, and 2% RPD was obtained from analyzing 12 portions of one lipstick brand over three days. The precision of the instrument was tested by analyzing an analytical solution seven times on one day, yielding 2% RPD. The ruggedness of the method was demonstrated by varying the analytical parameters. There were no signfi cant differences in Pb results with portion size variations of 0.1 to 0.4 g. The volume of HF was varied from 0 to 4 ml (0, 0.5, 1.0, 2.0, 3.0, and 4.0 ml). Pb recov- ery became constant when ≥1 ml was used. The 4% boric acid solution amount was var- ied from 6 ml to 60 ml (6, 20, 30, 40, and 60 ml), with Pb recovery becoming constant when ≥20 ml was used. Solutions also became clear, eliminating the need for fi ltration or centrifugation before ICP–MS analysis. There was no signifi cant change in Pb recovery when the maximum disgestion temperature was lowered from 200°C to 180°C. As a measure of quality control, each digestion batch included two RMs: lead in base oil 20 (representing organic Pb in an oily matrix) and estuarine sediment (representing a mineral matrix). Recovery of Pb from the RMs is shown in Figure 2. Method blanks and method blanks spiked near the detection level were also included in each digestion batch. The average and standard deviation for blanks from fi fteen batches Table III Lead Recoveries from Reference Materials and Lead Values from a Composited Lipstick With and Without HF* Certifi ed value (μg Pb/g) ±95% C.I. HNO3 only (μg Pb/g) HF + HNO3 (μg Pg/g) NIST 1635 (trace elements in coal) 1.9 0.2 1.8 (95%) 1.8 (95%) NIST 1084a (wear metals in oil) 101.1 1.3 103.7 (103%) SPEX ORG-PB8-2Y/Z (lead in base oil 20) 1000 1000 (100%) NIST 8435 (whole milk powder) 0.11 0.05 0.10 (91%) 0.11 (100%) NIST 1646a (estuarine sediment) 11.7 1.2 8.2 (70%) 10.8 (93%) Composited lipstick — — 0.29 2.91 *Values are the average of 3 to 15 samples. Recoveries are indicated in parentheses.
Purchased for the exclusive use of nofirst nolast (unknown)
From: SCC Media Library & Resource Center (library.scconline.org)