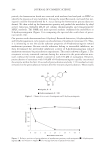
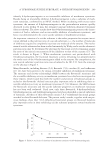
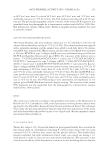
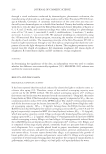
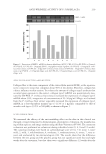
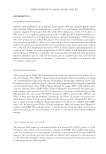
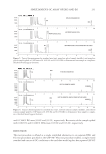
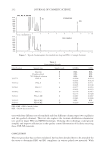
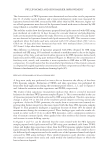
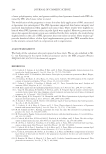
JOURNAL OF COSMETIC SCIENCE 232 Figure 7. Typical chromatograms for standard mix (top) and PEG-12 sample (bottom). Table I Experimental Results Identifi cation Sample type Suppler code % DEG % EG Glycerin B BDL BDL Proplene glycol E BDL BDL 70% Sorbitol solution F BDL BDL 39157-1 PEG-8 A 0.0268 0.0118 0.0291 0.0124 39157-2 PEG-8 C 0.0482 0.034 0.0495 0.0349 39158-1 PEG-12 A 0.0477 0.0216 0.0493 0.0223 39158-2 PEG-12 D 0.1138 0.0417 0.1174 0.0428 39191-1 PEG-6 ME A 0.0087 0.0087 0.0083 0.0086 39191-2 PEG-6 ME C BDL BDL 39191-3 PEG-6 ME D 0.0218 0.0096 PEG-6 ME = PEG-6 methyl ether. BDL = Below detection levels. tests with four different sets of standards and four different column types (two capillaries and two packed columns). This test also replaces the vacuum distillation-colorimetric test used for larger PEG and MPEG homologs. Utilizing this technology could greatly simplify and improve effi ciencies in the quality control laboratories of facilities receiving these USP-NF materials. CONCLUSION This test procedure has not been validated, but has been detailed here to be amenable for the assay to determine DEG and EG compliance in various polyol raw materials. With

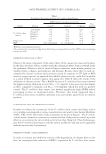
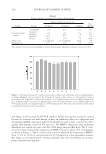
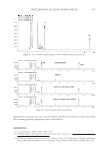
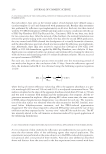
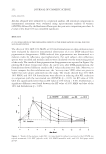
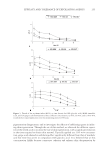
SIMULTANEOUS GC ASSAY OF DEG AND EG 233 appropriate standards, this basic test procedure could also be useful as an assay procedure for incoming glycerin, propylene glycol, and sorbitol. REFERENCES (1) U.S. Pharmacopeia, USP 32-NF 27, May 2009. (2) USP Hot Topics, USP Propylene Glycol and Sorbitol Solution Information, http://www.usp.org/hottopics/ propyleneGlycolSorbitolInformation.html (3) Guidance for Industry, Testing of Glycerin for Diethylene Glycol, U.S. Department of Health and Human Services Food and Drug Administration Center for Drug Evaluation and Research CDER), May 2007. Figure 8. Five standard chromatograms overlaid, demonstrating reproducibility. Figure 9. Chromatograms from spiking study.
Purchased for the exclusive use of nofirst nolast (unknown)
From: SCC Media Library & Resource Center (library.scconline.org)