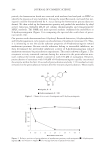
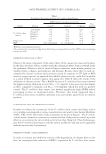
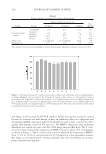
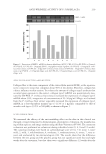
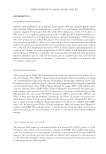
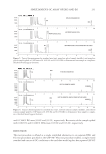
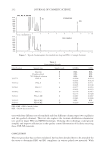
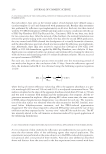
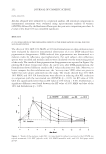
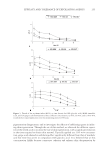
EFFICACY AND TOLERANCE OF EXFOLIATING AGENTS 253 IN VIVO EVALUATION OF SKIN ERYTHEMA INDUCED BY TOPICAL APPLICATION OF THE FORMULATIONS The skin erythema induced by topical application of three different concentrations (% w/w) of glycolic, mandelic, and grape acids was evaluated by refl ectance spectrophotometric mea- sures. Spectral data were recorded for each site treated with the formulations over a mon- itoring period of 50 hours. The AUC values calculated over the monitoring time are shown in Figure 2, and the trends in Δ.E.I. versus time are reported in Figure 3 (curves a, b, and c) at 10%, 30%, and 50% w/w. A signifi cant increase in skin erythema was observed from the lower to the higher concentrations for GLY, MAN, and GA. Further- more, at all three concentrations, GLY showed higher values of AUC than MAN and GA ( p 0.05). No statistical differences were found between MAN and GA at 10% w/w of concentration ( p 0.05). However, MAN induced a signifi cantly higher AUC than GA at 30% and 50% w/w ( p 0.05). IN VIVO EVALUATION OF THE PHOTOSENSITIZING EFFECTS INDUCED BY TOPICAL APPLICATION OF THE FORMULATIONS The increase in skin sensitivity to UV light, induced by topical application of the 10% GLY, MAN, and GA formulations, was expressed as the photosensitivity percentage calculated using the erythema index values obtained by the refl ectance spectrophotometric method. Table I RT (recovery time) Values for Each Subject, Obtained in Treating Skin Sites with 10% GLY (glycolic acid), 10% MAN (mandelic acid), and 10% GA (grape acids) Formulations or without Treatment (CONTR) Subjects CONTR 10% MAN 10% GA 10% GLY 1 15 12 7 6 2 15 9 7 7 3 15 12 10 8 4 15 10 10 5 5 14 10 10 9 6 14 10 6 6 7 14 9 8 8 8 15 10 9 6 9 11 15 10 7 10 15 14 7 8 11 15 13 9 9 12 13 15 10 7 13 15 9 9 4 14 14 11 8 5 15 15 9 7 7 16 13 14 11 6 17 15 13 7 7 18 14 10 7 5 19 15 12 11 4 20 14 10 8 6 Mean 14.30 11.35 8.55 6.50 S.D 1.03 2.06 1.54 1.47 The “recovery time” value (RT) was evaluated as the time (days) required to obtained an M.I. baseline value (before dihydroxyacetone treatment) for each site.

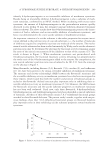
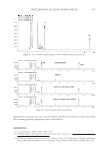
JOURNAL OF COSMETIC SCIENCE 254 As reported in Figure 4, topical application of the GLY formulation for four weeks in- duced a higher value of photosensitivity % than the MAN and GA formulations ( p 0.05), whereas the GA formulation induced a lower degree of skin erythema after UVB irradiation than the GLY and MAN formulations ( p 0.05). DISCUSSION Recently, many common alpha-hydroxy acids (AHAs) and combinations of them, such as mandelic acid, lactic acid, and natural acids present in fruits, wine, and milk have been extensively used as chemical peeling agents in cosmetic dermatological products. Known benefi cial effects of chemical exfoliation include improvement in several cutaneous dis- eases and conditions such as acne vulgaris, melasma, scarring, and photodamage. It was previously reported that to evaluate the effects of AHAs, it was essential to identify the type, the pH of the formulations, and above all the concentration employed (6). Thera- peutic/cosmetic peels required fairly high concentrations of AHAs (20–70%). However, the greatest impact of AHAs has been in skin-care and beauty products in which AHAs are employed at lower concentrations (4–10%). In the present study, we compared the effects of three organic acids employed at 10% w/w of concentration (glycolic acid, mandelic acid, and a blend of organic acids from grape juice) as exfoliating agents by topical application. To this purpose we used a new in vivo method of evaluation. For many decades, the fl uorescent dansyl chloride (DC) has been used as a marker on skin to assess stratum corneum turnover time and the exfoliation rate in vivo (21). However, the level of DC fl uorescence is often diffi cult to evaluate and the hazard of the dansyl chloride test is not negligible (22). Recently, dihydroxyacetone (DHA) has been intro- duced as a safe DC substitute. Since DHA can reach only the upper layers of the stratum granulosum, it is considered to be nontoxic. Although somewhat chemically distinct from melanins, the DHA-skin complex melanoids are very similar to melanins both spec- troscopically and physically (21,23). In this study, we introduce the use of the mela- nin index obtained by refl ectance spectrophotometric data to evaluate DHA-induced Figure 2. Mean area under curve (AUC) values (± SD) obtained by applying GLY (glycolic acid), MAN (mandelic acid), and GA (grape acids) formulations at three different concentrations (10%, 30% and 50% w/w) to skin sites of subjects admitted into the study. AUC values were directly related to the degree of skin erythema induced by topical application of the formulations. *p 0.05 (signifi cantly different) vs MAN and GA **p 0.05 (signifi cantly different) vs MAN ***p 0.05 (no signifi cantly different) vs MAN.
Purchased for the exclusive use of nofirst nolast (unknown)
From: SCC Media Library & Resource Center (library.scconline.org)