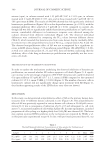
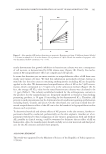
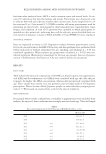
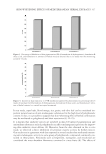
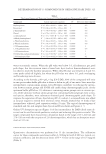
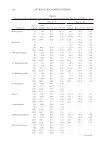
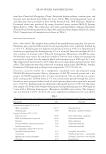
RELATIONSHIPS AMONG SKIN CONDITION IN WOMEN 305 free from other analytical tests. SACL is used to measure stress and arousal levels. It con- sists of 25 adjectives that describe feelings and moods. Participants use a four-point scale to indicate how well each adjective matches their current state. Scores range from 0 to 14 for stress and 0 to 11 for arousal (13). POMS is another self-rating questionnaire used for measuring six mood states: tension-anxiety, depression-dejection, anger-hostility, vigor, fatigue, and confusion. A total of 65 questions were included to which participants re- sponded on a fi ve-point scale, indicating how well the adjective given described their cur- rent mood (14). Japanese versions of SACL (J-SACL) (15) and POMS (16) were employed. STATISTICAL ANALYSIS Data are expressed as means ± S.D. Regression analysis between questionnaire scores, fatty acid concentrations in the RBC PL fraction, and skin problems were performed with (where indicated) or without adjustment for age, smoking, and drinking p 0.05 was considered signifi cant. When separate age groups were calculated, p 0.0125 was con- sidered signifi cant (Bonferroni’s adjustment for the four age groups). Statview ( Japanese version 5 SAS Institute, San Francisco, CA) was used for statistical calculations. RESULTS FATTY ACIDS Table I shows the fatty acid composition of the RBCs in all participants. Eicosapentaenoic acid (EPA) and docosahexaenoic acid (DHA) were correlated with age the older the par- ticipants, the higher the DHA concentration, whereas AA was inversely correlated with age. These trends were exactly as in our previous cross-sectional study of 456 Japanese participants. This is because elderly Japanese people eat more fi sh than younger genera- tions (17). We focused on essential fatty acids for the sake of simplicity. SKIN CONDITIONS Four people whose results confused hair or wrinkles as pigmentation were excluded from analysis. As expected, skin conditions were strongly associated with age. The total length Table I Fatty Acid Composition of the PL Fraction of Red Blood Cells (n = 132) Mean ± S.D. 16:0 24.6 ± 1.5 18:0 13.6 ± 1.0 18:1 n–9 13.7 ± 0.9 18:2 n–6 10.2 ± 1.1 18:3 n–3 0.2 ± 0.05 20:4 n–6 11.1 ± 1.1 20:5 n–3 1.3 ± 0.5 22:6 n–3 6.4 ± 1.0

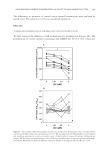
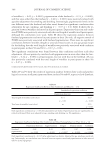
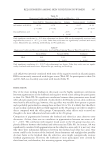
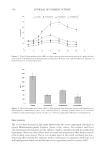
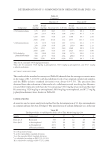
JOURNAL OF COSMETIC SCIENCE 306 of wrinkles (r = 0.65 p 0.0001), pigmentation of the forehead (r = 0.31 p = 0.0005), and that areas other than the forehead (r = 0.49 p 0.0001) were positively related with age after adjustment for smoking and drinking. Interestingly, pigmentation levels in the two different areas (the forehead and other areas) showed no signifi cant correlation after adjustment for age, smoking, and drinking (r = -0.07 p = 0.4). Table II shows the re- gression between wrinkles and mood in all participants. Depression-dejection and confu- sion (POMS) were positively associated with the total length of wrinkles in all participants, although the correlations were weak. Table III shows the regression analyses between forehead pigmentation and mood in participants in their 20s only all negative moods of POMS were positively associated with forehead pigmentation. There were no signifi cant correlations between wrinkles (length or area) and mood scores in any age group except for the fi nding that the total length of wrinkles was positively associated with confusion in participants in their 50s and 60 (r = 0.47 p = 0.01). Two signifi cant correlations were found between skin conditions and fatty acids after adjustment. AA was positively correlated with pigmentation in areas other than the fore- head (r = 0.24 p = 0.006) in all participants, but not with that in the forehead. AA was also positively correlated with the total length of wrinkles in participants in their 30s (r = 0.47 p = 0.006). CORRELATION BETWEEN FATTY ACIDS AND PSYCHOLOGICAL SCORES Tables IV and V show the results of regression analyses between fatty acids and psycho- logical test scores in all participants and those in their 50s and 60, respectively. α-Linolenic Table II Regression Coeffi cients Between Skin Conditions and Mood (n = 131) Standardized regression coeffi cient Depression-dejection Confusion Total length of wrinkles (crow’s feet) 0.14 0.19 p = 0.04 p = 0.004 Total area of wrinkles (crow’s feet) ns 0.16 p = 0.03 Only signifi cant correlations ( p 0.05 after adjustment) are shown. Pigmentation was not signifi cantly cor- related with mood. Data were adjusted for age, smoking, and drinking. ns: No signifi cance. Table III Regression Coeffi cients Between Skin Conditions and Mood Among Subjects in Their 20s (n = 34) Depression-dejection Anger-hostility Fatigue Tension-anxiety Confusion Forehead pigmentation 0.48 0.43 0.54 0.62 0.58 p = 0.005 p = 0.009 p = 0.0007 p 0.0001 p = 0.0006 Only signifi cant correlations ( p 0.0125 after adjustment) are shown. Adjusted for age, smoking, and drink- ing. Interestingly, no correlations were observed between negative mood and pigmentation in other areas of the face in any age groups.
Purchased for the exclusive use of nofirst nolast (unknown)
From: SCC Media Library & Resource Center (library.scconline.org)