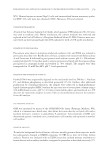
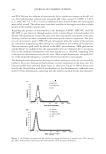
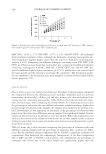
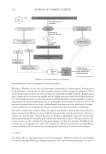
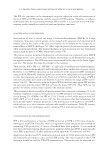
JOURNAL OF COSMETIC SCIENCE 280 RESULTS OXIDATIVE DNA BASE DAMAGE Primary keratinocyte and melanocyte cell cultures at approximately 50% confl uency were harvested and subjected to DNA isolation and digestion to the nucleoside level as described in the previous section. HPLC/EC analysis revealed that the endogenous level of 8-oxo-dG in NHEKs was 1.49 (±0.11 SEM)/106 dG, whereas melanoyctes were ob- served to have a higher level at 4.49 (±0.55 SEM) 8-oxo-dG/106 dG. These data represent a statistically signifi cant difference (p 0.005, two-tailed t-test) between these cell types and indicate higher oxidative DNA levels in melanocytes (Figure 1A). Further, in order to determine the effect of UVB-induced oxidative stress, melanocytes were then exposed to UVB. Interestingly, when melanocytes were exposed to 125 mJ/cm2 UVB, 8-oxo-dG levels increased nearly twofold to 8.09 (±1.22 SEM). In comparison, NHEKs increased similarly to 3.82 (±0.3 SEM) when exposed under the same conditions and indicates that Figure 1. DNA extracted from NHEKs and melanocytes were digested to the nucleoside level and analyzed by HPLC/EC for 8-oxo-dG. (A) Increased levels of 8-oxo-dG were observed in melanocytes compared to NHEKs. Data are expressed as mean ± SEM, *p 0.005. (B) Cells were exposed to 125 mJ/cm2 UVB and then analyzed. Similar UV-induced increases in 8-oxo-dG were measured for both NHEKs and melanocytes. Data are expressed as mean ± SEM.

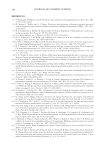
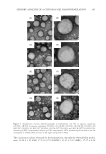
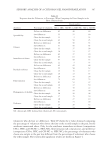
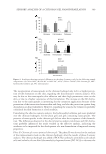
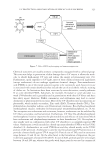
ENDOGENOUS DNA OXIDATION CORRELATES TO INCREASED IRON LEVELS IN MELANOCYTES 281 although melanocytes have higher endogenous levels of oxidative DNA, they have the same relative susceptibility as NHEKs to UVB-induced oxidative stress (Figure 1B). One possible explanation for the higher 8-oxo-dG values in melanocytes may have been the difference in growth media. To test this, melanocyte medium was incubated with NHEKs overnight to determine the contribution of medium components to oxidative DNA damage. The next day, cells were harvested and 8-oxo-dG analyzed. In these ex- periments, the average control value for NHEKs was 1.96 (±0.5 SEM)/106 dG while the melanocyte-medium-treated NHEK value was 1.65 (±0.57 SEM)/106 dG. Thus, the higher oxidative levels observed in the DNA of melanocytes were not due to differences in medium components. Additionally, NHEK and melanocyte cell cultures were syn- chronized by serum starvation and their 8-oxo-dG levels assessed for any possible cell cycle effects. The results from this experiment were consistent with our other data, which indicated higher oxidative DNA levels in melanocytes (data not shown). To further understand the nature of the relative differences in 8-oxo-dG between NHEKs and melanocytes, two murine melanocytic cell lines referred to as melan a and melan c were also evaluated. Although both types of cells are melanocytic in origin, the melan c line has a defective tyrosinase gene and is devoid of melanin. If melanogenesis increases the level of oxyradicals in the cell, the level of 8-oxo-dG should be lower in the melan c cells. However, as shown in Figure 2, only a nonsignifi cant decrease in 8-oxo-dG was observed in melan c cells as compared to melan a cells. Nevertheless, both melan a and melan c cells were higher in oxidative DNA than in NHEKs and show a greater similar- ity to human melanocytes, which might be characteristic of these cells. Glutathione. As a gauge on the overall oxidative state of the cells, total GSH levels were also measured and found to be lower in melanocytes than in NHEKs. GSH in NHEKs was calculated to contain 5.98 nmoles (±0.33 SEM)/cell while in eumelanin-producing melanocytes this level was 3.14 nmoles (±0.15 SEM)/cell and would appear to be consis- tent with an oxidatively challenged cellular environment. However, the oxidized dimer of GSH, GSSG, was 12.2% for both cell types and these results are summarized in Figure 3. Although lower total GSH levels in melanocytes should foster a more oxidatively Figure 2. DNA extracted from NHEKs and melanocytes were digested to the nucleoside level and analyzed by HPLC/EC for 8-oxo-dG. Oxidative DNA levels in two melanocyte-derived cell lines: melan a and melan c were more similar to melanocytes than to NHEKs. Data are expressed as mean ± SEM.
Purchased for the exclusive use of nofirst nolast (unknown)
From: SCC Media Library & Resource Center (library.scconline.org)