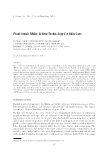
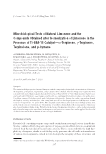
JOURNAL OF COSMETIC SCIENCE 132 behavior at air–water interface. SL was explored as a potential addition to the system to understand whether it brings about any additional new synergistic effect. Figure 5 highlights the behavior of SL in both binary and ternary surfactant systems in the binary system with CAPB, CAPB is incrementally substituted with SL. It is observed that a surface tension value below that of either pure SL or pure CAPB is achieved at equal ratios. This clearly shows an synergistic interaction between CAPB and SL. In the ternary system with the addition of SL to CAPB and RL mixture, there does not seem to be sig- nifi cant impact on the surface tension reduction, with lowest surface tension in the sys- tem being 24.9 mN/m, close to pure RL. This indicated that RL seems to dominate at the air–water interface. Figure 6 highlights the surface elasticity behavior of SL in both binary and ternary sys- tems. The surface elasticity of the ternary system with CAPB/RL/SL is higher than both binary system of CAPB/SL and the pure SL system. This further corroborates that RL is competitive at the interface, being substantiated with both surface tension and surface elasticity measurements. This can result in an elastic layer and tighter packing for high foam stability, ideally desired in a personal cleansing application. Figure 6. Surface elasticity comparison of the ternary CAPB/RL/SL system with binary CAPB/SL system and pure SL system. Figure 5. Effect of SL addition in the binary system with CAPB and ternary system with CAPB and RL.

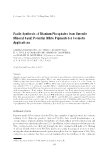
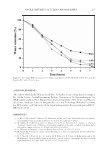
SURFACE ACTIVITY OF BIOSURFACTANT–SURFACTANT MIXTURES 133 Figure 7 compares the surface elasticity of the ternary CAPB/RL/SL system with the bi- nary CAPB/RL system. Here, it is seen that the surface elasticity of the two samples was approximately the same, which indicates that the RL is the dominant species at the air– water interface. The RL at the air–water interface provides a strong surface layer, which potentially enhances foam stability. FOAMING PROPERTY To directly evaluate the performance aspects of the surface tension and the surface elastic- ity optimization with RL, a foaming test was performed. Figure 7. Comparison of the surface elasticity of CAPB/RL/SL and CAPB/RL. Figure 8. Result of the foaming test. Bottles from left to right: pure CAPB at pH 5.5, pure CAPB at pH 7.0, CAPB/RL at pH 5.5, and CAPB/RL/SL at pH 5.5. Times of photo taken were as following: (A) after shaking (B) after 5 min (C) after 15 min (D) after 30 min (e) after 45 min.
Purchased for the exclusive use of nofirst nolast (unknown)
From: SCC Media Library & Resource Center (library.scconline.org)