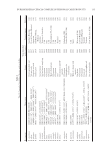
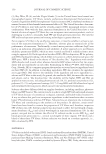
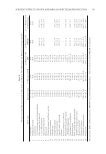
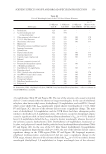
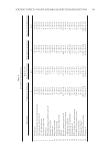
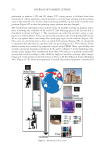
JOURNAL OF COSMETIC SCIENCE 152 a total of 167 solvents were ranked for each UV fi lter and the blend of UV fi lters based on the IAG. In addition, we evaluated the ingredient list of 12 commercial sunscreens to understand which solvents/potential SPF booster ingredients they included. FFE predications and fi nd- ings from commercial products helped us select 24 solvents for this project (Table I). UV FILTER–SOLVENT MIXTURES Mixtures containing a ratio of 1:9 UV fi lter:solvent (w/w) were prepared for the in vitro SPF testing. One gram of UV fi lter was measured into a beaker on an analytical balance with a readability of 0.001 g, and 9 g of solvent was added to it. The beaker was placed on a magnetic stir plate and mixed at 650 rpm for 10 min for liquid UV fi lter–solvent mixtures. Solid UV fi lter–solvent mixtures were placed on a magnetic stirrer with hot plate at 85°C for 30 min at 650 rpm. In addition, another set of mixtures was created containing the maximum allowed con- centration of each UV fi lter (i.e., 15% of homosalate, 5% ethylhexyl salicylate, and 3% of butyl methoxydibenzoylmethane) per the OTC monograph (20). These mixtures contained Table I IAG between Each Solvent and UV Filter/UV Filter Blend Calculated by FFE™ INCI name IAG with H IAG with EHS IAG with BMDM IAG with UV fi lter blend 1 Isododecane 9.78 10.0 12.14 10.08 2 Cyclotetrasiloxane and cyclopentasiloxane 11.94 11.81 14.64 12.22 3 Olea europaea (olive) fruit oil 3.26 2.92 7.97 3.61 4 C12-15 alkyl benzoate 2.47 3.04 4.63 2.65 5 Shea butter ethyl esters 5.00 5.25 7.75 5.32 6 Mineral oil 5.08 5.19 8.13 5.42 7 Helianthus annuus (sunfl ower) seed oil 2.98 2.69 6.64 3.33 8 Isopropyl isostearate 4.79 4.67 8.10 5.12 9 Dimethicone 11.70 11.60 14.41 11.99 10 Heptyl undecylenate 5.01 5.22 7.82 5.33 11 Isopropyl myristate 4.53 4.66 7.57 4.87 12 Caprylic/capric triglyceride 6.23 6.67 8.46 6.52 13 Ethanol 15.49 14.53 17.54 15.48 14 Ricinus communis (castor) oil 5.90 6.09 7.97 6.11 15 Propanediol dicaprylate/caprate 3.76 3.69 6.96 4.07 16 2-Ethylhexyl palmitate 5.97 6.25 8.55 6.28 17 Diethylhexyl 2,6-naphthalate 4.10 4.44 6.71 4.39 18 Pentylene glycol 15.01 14.14 16.66 16.8 19 PPG-3 benzyl ether ethylhexanoate 3.54 3.88 6.44 3.87 20 Tris(PPG-3 benzyl ether) citrate 3.16 2.77 6.81 3.49 21 Butyloctyl salicylate 1.46 1.54 4.98 1.79 22 Diisopropyl adipate 3.67 3.13 7.12 4.11 23 Ethylhexyl methoxycrylene 0.98 1.98 3.42 1.08 24 Polyester-8 3.17 3.49 5.68 3.41 H: homosalate, EHS: ethylhexyl salicylate, BMDM: butyl methoxydibenzoylmethane. Values in italics denote excellent quality, in-bold denote poor quality, and those without formatting denote good quality.

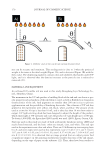
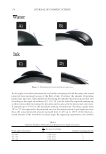
SOLVENT EFFECTS ON SPF AND BROAD-SPECTRUM PROTECTION 153 2.3 g of UV fi lters and 7.7 g of solvent and were prepared using the aforementioned method. Each mixture was allowed to sit for 10 min after mixing to determine solubility. Signs of physical separation were visually determined. IN VITRO SPF AND CRITICAL WA VELENGTH TESTING AND WAVELENGTH OF MAXIMUM ABSORBANCE The Food and Drug Administration (FDA) 2011 method (21 ) was used for testing in vitro SPF (Labsphere UV-2000S, North Sutton, NH) using polymethylmethacrylate (PMMA) plates (HelioScreen HelioPlates HD6, Labsphere). A 5 × 5-cm PMMA plate was tared on an ana- lytical balance with a readability of 0.001 g. As per the FDA method, 2 mg/cm2 of the UV fi lter–solvent mixture (total of 50 mg) was applied to the plate, and using a fi nger cot, the mixture was spread in a circular motion for 30 s, vertical motion for 15 s, and horizontal mo- tion for another 15 s to ensure complete and even coverage. Then the plate was placed in a dark drawer for 15 min. Each plate was scanned in fi ve different locations, each UV fi lter–solvent mixture was tested on three different plates. The software (UVS2000 Application, Labsphere) measured absorbance and converted it to in vitro SPF using an algorithm. In the United States, to label a sunscreen broad spectrum, the product has to have a critical wavelength of at least 370 nm. Critical wavelength is the wavelength below which 90% of the area under the absorbance curve resides (21). The same PMMA plates and same amount of UV fi lter–solvent mixture was used for broad-spectrum testing. Critical wavelength was calculated by the Labsphere software. The λmax values were obtained f rom the absorbance results. SPREADABILITY TESTING Spreadabil ity of each solvent wa s determined using a TA.XTPlus texture analyzer (Texture Technologies Corp., Hamilton, MA) and a spreadability fi xture. Test mode was set to “measure force in compression,” and “return to start” option was used. Trigger type was set to “button.” The male cone’s penetration distance was set to 1 mm less than the start- ing point distance. Test speed and post-test speed were set to 3.0 mm/s. Exponent stable micro-systems software (version 6.1.10.0, Texture Technologies Corp., Hamilton, MA) was used to generate spreadability curves. STATISTICAL ANALYSIS Differences in in vitro SPF, λmax, critical wavelength, and spreadability were evaluated using one-way analysis of variance followed by Tukey’s multiple comparison test using SPSS Statistics 21 software (IBM, Armonk, NY). A p value less than 0.05 was taken as the minimal degree of statistical signifi cance. RESULTS FFE FFE calculated the IAG for eac h UV fi lter–solvent mixture (Table I). Among the solvents tested, there were excellent solvents (arbitrary IAG range: 1–5), good solvents (arbitrary
Purchased for the exclusive use of nofirst nolast (unknown)
From: SCC Media Library & Resource Center (library.scconline.org)