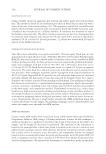
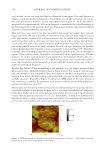
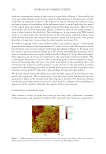
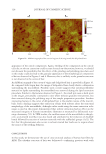
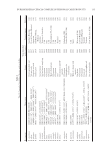
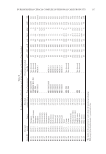
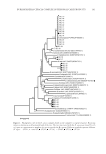
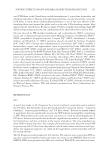
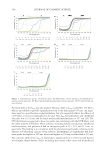
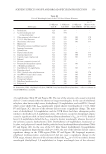
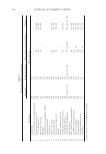
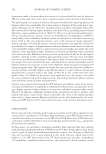
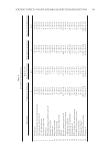
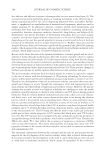
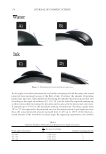
JOURNAL OF COSMETIC SCIENCE 174 As the angle of incidence bet ween the nail surface and projected ink decreases, the actual projected area increases because of the fl ow of ink. It reduces the amount of spraying printed per unit area. The problem of decreasing the amount of projection per unit area according to the angle of incidence b R b 15 30° ° can be solved by repeated printing up to three times while increasing the precision and accuracy for the projection correction. It expands up to 150% of the maximum amount of projection. Incidence angles from 30° to 70° are supposed to be projected twice in the same position to get high precision thus, the actual projected amount increased from 114% up to 181% of the ideal pro- jected amount of the minimum incident angle. By repeating experiments, the number Table I Different Numbers of Printed Layers Depend on the Angle of Incidence θ (the angle of incidence) P I W W (the ratio of settling) Number of printing (layers) 70°–90° 0.94–1.00 1 30°–70° 0.50–0.94 2 15°–30° 0.26–0.50 3 Figure 4. Distribution of water and ink per unit area.

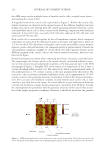
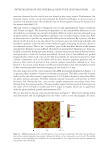
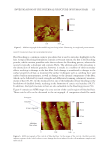
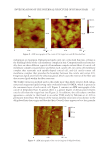
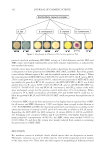
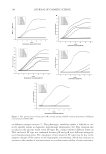
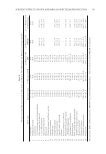
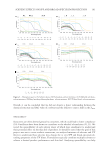
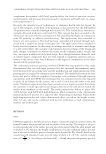
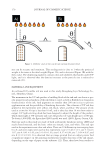
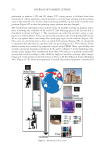
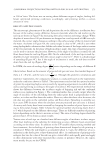
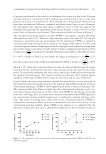
CONFORMAL PROJECTION PRINTING METHOD FOR 3D NAIL ART PRINTING 175 of printing performed on the surface can determine the accuracy of the result. Printing one layer results in a minimum of 94% settling ratio, and printing it twice in the same position can result in a maximum of 182% settling ratio. Areas printed three times or twice have no numerical difference compared with areas printed twice or once. However, the area printed twice and one time shows a difference of up to 90% that indicate the boundary. By repeating the experiments with various designs, a result of 100% or even more of the settling ratio was obtained. These numerical results are shown in Figure 5. The conventional printing method, in which CPPM is not applied, can print the image when the theta value is 90°. However, when the theta value is less than 90°, the ink dis- tribution is nonuniform because of spreading. On the other hand, CPPM is a method of calculating the drop settling of ink according to the change of the angle of incidence and concentrating the amount of ink deposited in the same place with repeated printing from one to three layers to get distinct results. Figure 5 shows a graphical representation of the settling ratio of I WP W (actual projected weight/ideal projection weight) to the different values (15°–90°), as shown in Table I. As seen before, the ranges of settling ratio is b1. 0 WP WI To have the accuracy and clarity of the result through the CPPM, it reaches at 1 ¬ WP ® I W = 100% when θ = 90°, where the actual and ideal projections are matched. But because the output is printed on the conformal nail, the theta value decreases as the curvature becomes more severe. To increase the settlement rate, the accuracy and clarity of the result are increased by the number of printed layers. This study was based on achieving 100% settling degree, regardless of the range of different theta values for the clarity and accuracy of the print. Figure 6 shows the piston-type extrusion method that prints high viscosity materials on the boundary with a laser guide for precise 3D printing, which differs from the results of conventional printing to CPPM to show improvement in the accuracy of the print (26). The printing results from Figure 6 imply that three-dimensional sculptures can be con- structed by repeated printing up to three times with CPPM. In the process of printing more than 300 image fi les, the results were compared with those of the CPPM applied to the conventional printing method (single layer), including the analyzed printing condi- tions. The result of stacking up to three times on the conformal surface by CPPM in- creased three-dimensional effects as it was accumulated on the Z-axis one by one. In the conventional printing method, where CPPM is not applied, it is confi rmed that the amount of output per unit area is absolutely insuffi cient at the curvature because of Figure 5. The comparison of the conventional single layer printing method and CPPM with WP/WI rate distribution graph.
Purchased for the exclusive use of nofirst nolast (unknown)
From: SCC Media Library & Resource Center (library.scconline.org)