132 JOURNAL OF COSMETIC SCIENCE
PHYSICAL STABILITY
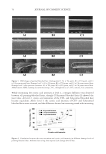
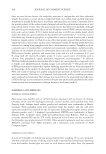
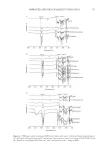
The physical stability of the selected formulation was evaluated in a Turbiscan Lab Expert
analyzer (Formulation Inc., Toulouse, France). The detection head was composed of a pulsed
near-infrared light source (k =850 nm) and transmission and backscattering detectors.
The NLC sample was placed in a cylindrical glass tube and scanned throughout the tube
height every 30 minutes continuously for 24 hours at 37°C. The stability of the formulation
was determined through the variation of backscattering of the sample over the monitored
time, using Easysoft© software (Easysoft, Wetherby, United Kingdom).
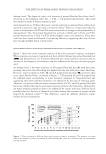
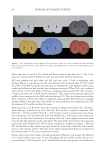
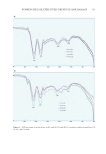
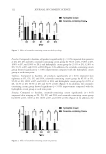
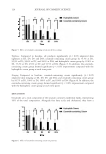
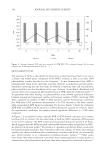
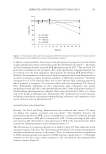
PHOTOSTABILITY STUDY
Samples of NLC encapsulating AVB, NLC without AVB and of AVB dissolved in ACN
(n =3) were subjected to UVA radiation (3,025 mW/cm²) for 24 hours in a photostability
chamber (424 CF, Nova Ética, Brazil) equipped with a near-UV fluorescent lamp (15 W)
with a spectral distribution from 320–400 nm and several cool white fluorescent lamps
(15 W). The samples collected before irradiation, after 2, 4, 8, and 24 hours of irradiation,
and quantifications of AVB were performed by HPLC.
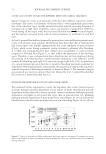
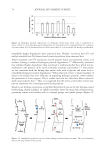
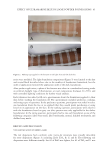
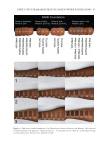
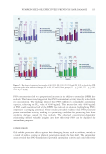
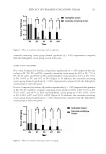
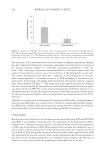
SKIN RETENTION AND PERMEATION
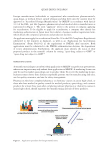
For the in vitro study of cutaneous retention in pig ear skin, manual vertical Franz-type
static flow cells equipment (Hanson Research, USA) were used under agitation of 300 rpm,
at 37°C and a diffusion area of 1.86 cm2. The receiving compartment contained 6.7 mL
of phosphate-buffered saline (PBS) buffer solution (pH: 7.4) with 5% Tween20, with 1 mL
samples being collected at each time point. The 400 µm skin was positioned between the
two compartments with the stratum corneum facing up. 18.5 µL of the formulation were
applied on the stratum corneum surface to maintain sink conditions (data not shown).
Samples were collected at 2, 4, 6, 8, and 24 hours of permeation and were quantified by
HPLC. The study was conducted under the norms of research involving animals with
protocol CEUA/UFG nr. 105/22.
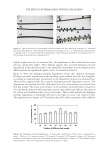
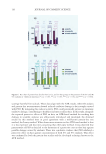
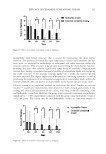
To evaluate the cutaneous retention of nano encapsulated AVB on the skin surface, the skins
were removed from the compartments after 24 hours of exposure and were washed with 2 mL
of PBS buffer solution (pH: 7.4) containing 5% Tween 20. Next, tape stripping was performed
using adhesive tape to remove the stratum corneum. This procedure was repeated 15 times on
each skin, and then the strips were added in 15 mL tube with 5 mL of ACN, homogenized
for 2 minutes in a vortex, transferred to the ultrasound bath for 20 minutes, and then filtered
through a PVDF membrane (0.45 µm) for quantification by HPLC. Finally, the remaining
skin was fragmented, diluted in 5 mL of can, and homogenized for 2 minutes in a vortex. The
homogenate was kept under ultrasound for 20 minutes and then filtered (PVDF 0.45 µm).
The assay was performed six times, and all samples were quantified by HPLC.
STATISTICAL ANALYSIS
A student’s t-test was used to compare the sets of data in Graphpad Prism software version 5.0
(Graphpad Prism Inc., Massachusetts USA), and p values 0.05 were considered significant.
PHYSICAL STABILITY
The physical stability of the selected formulation was evaluated in a Turbiscan Lab Expert
analyzer (Formulation Inc., Toulouse, France). The detection head was composed of a pulsed
near-infrared light source (k =850 nm) and transmission and backscattering detectors.
The NLC sample was placed in a cylindrical glass tube and scanned throughout the tube
height every 30 minutes continuously for 24 hours at 37°C. The stability of the formulation
was determined through the variation of backscattering of the sample over the monitored
time, using Easysoft© software (Easysoft, Wetherby, United Kingdom).
PHOTOSTABILITY STUDY
Samples of NLC encapsulating AVB, NLC without AVB and of AVB dissolved in ACN
(n =3) were subjected to UVA radiation (3,025 mW/cm²) for 24 hours in a photostability
chamber (424 CF, Nova Ética, Brazil) equipped with a near-UV fluorescent lamp (15 W)
with a spectral distribution from 320–400 nm and several cool white fluorescent lamps
(15 W). The samples collected before irradiation, after 2, 4, 8, and 24 hours of irradiation,
and quantifications of AVB were performed by HPLC.
SKIN RETENTION AND PERMEATION
For the in vitro study of cutaneous retention in pig ear skin, manual vertical Franz-type
static flow cells equipment (Hanson Research, USA) were used under agitation of 300 rpm,
at 37°C and a diffusion area of 1.86 cm2. The receiving compartment contained 6.7 mL
of phosphate-buffered saline (PBS) buffer solution (pH: 7.4) with 5% Tween20, with 1 mL
samples being collected at each time point. The 400 µm skin was positioned between the
two compartments with the stratum corneum facing up. 18.5 µL of the formulation were
applied on the stratum corneum surface to maintain sink conditions (data not shown).
Samples were collected at 2, 4, 6, 8, and 24 hours of permeation and were quantified by
HPLC. The study was conducted under the norms of research involving animals with
protocol CEUA/UFG nr. 105/22.
To evaluate the cutaneous retention of nano encapsulated AVB on the skin surface, the skins
were removed from the compartments after 24 hours of exposure and were washed with 2 mL
of PBS buffer solution (pH: 7.4) containing 5% Tween 20. Next, tape stripping was performed
using adhesive tape to remove the stratum corneum. This procedure was repeated 15 times on
each skin, and then the strips were added in 15 mL tube with 5 mL of ACN, homogenized
for 2 minutes in a vortex, transferred to the ultrasound bath for 20 minutes, and then filtered
through a PVDF membrane (0.45 µm) for quantification by HPLC. Finally, the remaining
skin was fragmented, diluted in 5 mL of can, and homogenized for 2 minutes in a vortex. The
homogenate was kept under ultrasound for 20 minutes and then filtered (PVDF 0.45 µm).
The assay was performed six times, and all samples were quantified by HPLC.
STATISTICAL ANALYSIS
A student’s t-test was used to compare the sets of data in Graphpad Prism software version 5.0
(Graphpad Prism Inc., Massachusetts USA), and p values 0.05 were considered significant.