138 JOURNAL OF COSMETIC SCIENCE
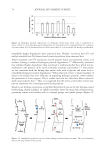
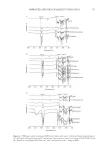
cases, the use of methods that evaluate molecular interactions at a chemical level can help
to elucidate or facilitate the identification of the nature of these interactions. No major
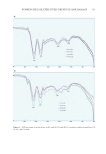
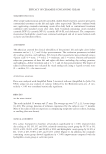
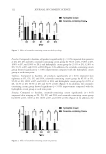
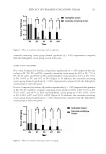
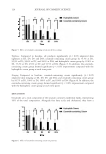
changes were observed in the FTIR data, which would indicate incompatibility between
the active ingredient and the excipients evaluated. Therefore, it can be suggested that the
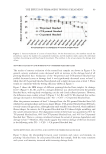
changes (interactions) observed with the DTA/TG-DTG and FTIR analyzes are indicative
of changes in the physical state of the active ingredient, which is dissolved or solubilized in
the melted/heated excipients.
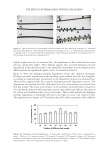
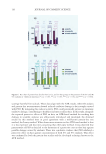
PREPARATION OF THE NANOSTRUCTURED LIPID CARRIERS
The compatibility experiments, using commonly available excipients for the preparation of
NLCs, demonstrated that carnauba wax, isopropyl myristate, Span 85, and Tween 80 were
suitable for the preparation of NLCs encapsulating AVB. Three formulations with different
proportions of the selected lipid-based excipients (solid-lipid, liquid-lipid, and surfactant
and cosurfactant) were tested for the preparation of the NLCs (Table I).
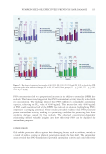
Initially, 5% of surfactants were evaluated in relation to the total formulation (F1). For
F2 and F3 formulations, 7% of surfactants were tested for the preparation for NLCs. The
ratio of the surfactants used to obtain the NLCs was based on the required hydrophilic–
lipophilic balance for the formulation (mathematical model/data not shown). Formulations
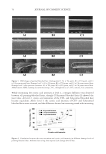
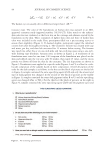
F1, F2, and F3 showed the formation of emulsions. After 24 hours, the presence of
agglomerates, indicating instability, were observed in F2. F3 formulation remained without
signs of instability, showing a milky and homogeneous appearance, with average particle
size and PdI of 138.9 ± 43.86 and 0.144 ± 0.03, respectively. After 7 days, however, oil
droplets were observed, indicating a coalescence process. The mean particle diameter and
PdI after 7 days were 145.9 ± 57.32 and 0.196 ± 0.04. F3 was then subjected to 3 cycles of
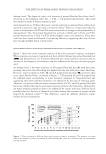
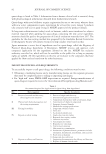
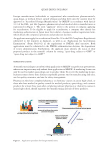
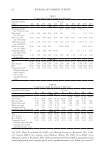
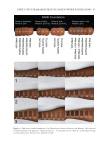
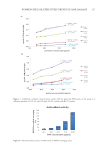
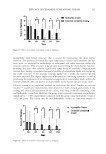
homogenization at 400 bar, and again evaluated for a period of 7 days (Table II). The high-
pressure homogenization technique was chosen because of its feasibility of scale-up and for
producing particles of smaller sizes compared to other techniques, thus contributing to the
improvement of formulation stability.28 After this new homogenization cycle, formulation
F3 did not show changes in the macroscopic aspect. Mean diameter and PdI, shown in
Table II, did not show statistical differences during the 7 days of evaluation (p 0.05).
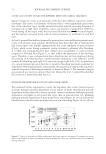
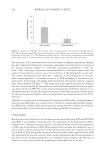
The EE% of AVB in the freshly prepared samples was 72.8% ± 1.8%. F3 formulation was
then chosen as the most macroscopically stable, and with acceptable diameter and PdI for
encapsulation of AVB and was then further investigated.
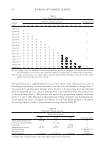
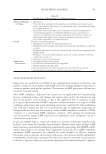
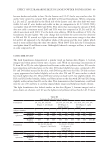
Table II
Mean Diameter (MD), in nm, and Polydispersity Index (PdI) of the NLC Formulations (F3) Submitted to
Continuous Microfluidization Cycles at 400 Bar.
Day Cycle 1 Cycle 2 Cycle 3
MD ± sd PdI ± sd MD ± sd PdI ± sd MD ± sd PdI ± sd
0 148 ± 42 0.15 ± 0.02 138 ± 45 0.14 ± 0.03 139 ± 45 0.15 ± 0.03
1 153 ± 43 0.15 ± 0.05 137 ± 47 0.17 ± 0.04 137 ± 46 0.15 ± 0.03
5 160 ± 44 0.17 ± 0.03 182 ± 56 0.18 ± 0.04 141 ± 49 0.14 ± 0.02
7 171 ± 38 0.16 ± 0.06 146 ± 51 0.16 ± 0.05 144 ± 50 0.17 ± 0.03
*Samples were monitored for 7d after preparation. N =3, p 0.05.
cases, the use of methods that evaluate molecular interactions at a chemical level can help
to elucidate or facilitate the identification of the nature of these interactions. No major
changes were observed in the FTIR data, which would indicate incompatibility between
the active ingredient and the excipients evaluated. Therefore, it can be suggested that the
changes (interactions) observed with the DTA/TG-DTG and FTIR analyzes are indicative
of changes in the physical state of the active ingredient, which is dissolved or solubilized in
the melted/heated excipients.
PREPARATION OF THE NANOSTRUCTURED LIPID CARRIERS
The compatibility experiments, using commonly available excipients for the preparation of
NLCs, demonstrated that carnauba wax, isopropyl myristate, Span 85, and Tween 80 were
suitable for the preparation of NLCs encapsulating AVB. Three formulations with different
proportions of the selected lipid-based excipients (solid-lipid, liquid-lipid, and surfactant
and cosurfactant) were tested for the preparation of the NLCs (Table I).
Initially, 5% of surfactants were evaluated in relation to the total formulation (F1). For
F2 and F3 formulations, 7% of surfactants were tested for the preparation for NLCs. The
ratio of the surfactants used to obtain the NLCs was based on the required hydrophilic–
lipophilic balance for the formulation (mathematical model/data not shown). Formulations
F1, F2, and F3 showed the formation of emulsions. After 24 hours, the presence of
agglomerates, indicating instability, were observed in F2. F3 formulation remained without
signs of instability, showing a milky and homogeneous appearance, with average particle
size and PdI of 138.9 ± 43.86 and 0.144 ± 0.03, respectively. After 7 days, however, oil
droplets were observed, indicating a coalescence process. The mean particle diameter and
PdI after 7 days were 145.9 ± 57.32 and 0.196 ± 0.04. F3 was then subjected to 3 cycles of
homogenization at 400 bar, and again evaluated for a period of 7 days (Table II). The high-
pressure homogenization technique was chosen because of its feasibility of scale-up and for
producing particles of smaller sizes compared to other techniques, thus contributing to the
improvement of formulation stability.28 After this new homogenization cycle, formulation
F3 did not show changes in the macroscopic aspect. Mean diameter and PdI, shown in
Table II, did not show statistical differences during the 7 days of evaluation (p 0.05).
The EE% of AVB in the freshly prepared samples was 72.8% ± 1.8%. F3 formulation was
then chosen as the most macroscopically stable, and with acceptable diameter and PdI for
encapsulation of AVB and was then further investigated.
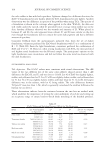
Table II
Mean Diameter (MD), in nm, and Polydispersity Index (PdI) of the NLC Formulations (F3) Submitted to
Continuous Microfluidization Cycles at 400 Bar.
Day Cycle 1 Cycle 2 Cycle 3
MD ± sd PdI ± sd MD ± sd PdI ± sd MD ± sd PdI ± sd
0 148 ± 42 0.15 ± 0.02 138 ± 45 0.14 ± 0.03 139 ± 45 0.15 ± 0.03
1 153 ± 43 0.15 ± 0.05 137 ± 47 0.17 ± 0.04 137 ± 46 0.15 ± 0.03
5 160 ± 44 0.17 ± 0.03 182 ± 56 0.18 ± 0.04 141 ± 49 0.14 ± 0.02
7 171 ± 38 0.16 ± 0.06 146 ± 51 0.16 ± 0.05 144 ± 50 0.17 ± 0.03
*Samples were monitored for 7d after preparation. N =3, p 0.05.