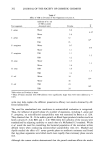
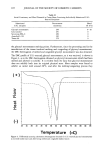
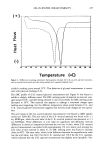
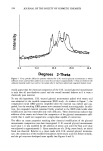
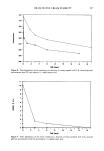
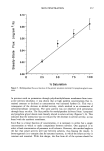
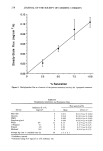
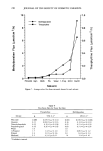
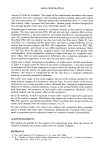
SKIN PENETRATION 237 0.10 0.08 0.06 0.04 0.02 0.00 0 25 50 75 100 % Saturation Figure 5. Methylparaben flux as a function of the percent saturation (activity) for propylene glycol treat- ment. In previous work on permeation through polydimethylsiloxane membranes from inter- active solvents (alcohols), it was shown that at high paraben concentrations flux re- mained constant or declined as concentration was increased further (5). This was a consequence of the decrease in alcohol activity, which resulted in an attenuation of solvent/membrane interaction. The same pattern was not observed with permeation through fuzzy rat skin. The flux profiles for methylparaben delivered from 1-propanol and propylene glycol donors were linearly related to solute activity (Figures 5 6). This indicates that the interaction was not reduced by the decrease in solvent activity, as was found with the synthetic membrane. Since flux is a linear function of concentration, it is necessary to utilize but a single concentration at which to make comparisons between solvents. One approach is to select a fixed concentration of permeant in all solvents. However, this method neglects the fact that solute activity will vary between solvents, thus biasing the results. A better approach is to compare data for saturated systems, in which the solute activity is constant and maximal. With this design, the flux from all of the systems should be

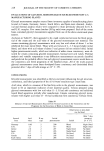
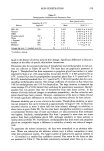
238 JOURNAL OF THE SOCIETY OF COSMETIC CHEMISTS 0.12 - 0.10 E '•- 0.08 E x • 0.06 • 0.04 "'-' 0.02 0.00 0 25 50 75 100 % Saturation Figure 6. Methylparaben flux as a function of the percent saturation (activity) for 1-propanol treatment. Table III Theophylline Solubilities and Permeation Data Flux (Ixmol/cm2/h) Solubility @ 37øC Solvent (mg/cm 3) n Mean 95% C.I. a PEG 400 9 0.011 Glycerin 5 0.014 0.012 DMIS 6 0.029 0.024 Propylene glycol 6 0.044 0.032 Water l0 b 12 0.13 0.12 1-Propanol 4.1 6 0.21 0.17 Ethanol 4.8 6 0.29 0.27 Methanol 8.4 6 0.65 0.54 Average lag time +_ standard error (h) 56 1.5 ñ 0.1 0.011 • x • 0.012 0.016 0.033 0.057 0.14 0.25 0.32 0.75 Confidence interval. Calculated using 8.07 mg/cm 3 at 32øC (reference 10).
Purchased for the exclusive use of nofirst nolast (unknown)
From: SCC Media Library & Resource Center (library.scconline.org)