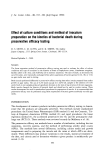
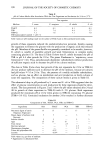
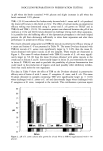
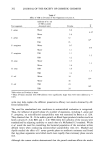
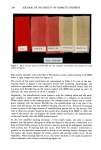
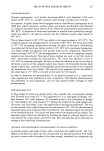
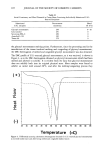
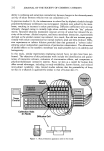
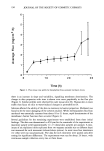
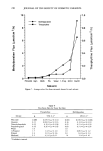
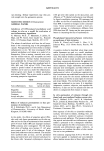
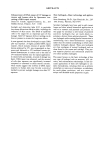
INOCULUM PREPARATION IN PRESERVATION TESTING 197 contains no added glucose. The pH values for uninoculated PCA, TSA, and TSALT were pH 6.8, 7.1, and 7.1, respectively. These pH determinations suggested that extended incubation on solid agar media did not cause these bacteria to produce acid that could cause metabolic stress consequently, the effect of incubating the test organisms on TSALT for 24, 48, and 72 hr on preser- vative efficacy testing was studied. Excellent reproducibility of test data was obtained when these cultures were used in preservative efficacy testing of lotion A. Thus, D- values obtained with 24-, 48-, and 72-hr cultures were within 0.1 hr for S. aureus, O. 5 hr for P. aeruginosa, 0.3 hr for B. subtills (ATCC 6633), and 0.3 hr for E. coli (Figure 1). These differences of 0.5 hr for repetitive analyses of lotion A samples using the same test organism are considered to be within the precision limits of the linear regression method (7). This study was repeated two times with essentially the same results. Sim- ilar results were obtained when this experiment was repeated, in triplicate, with lotion B. This demonstrates that saline inocula from surface growth from 24-, 48-, or 72-hr TSALT cultures provide essentially the same D-values in preservative efficacy testing of these lotions with these test organisms. Although surface growth of the test organisms on solid media produced negligible acidity during the 72-hr incubation period, growth in TSB, which contains 0.25% glucose, caused an appreciable drop in pH of some of the test cultures after growth for 24 hr (Table II). The data illustrate that S. aureus and E. coli reduced the pH of TSB from the initial pH of 7.2 to pH 5.3 and 5.7, respectively. These organisms are facul- tative aerobes, which means that they can grow either aerobically or anaerobically. Although the static broth tubes were incubated aerobically, it is believed that rapid ,..,4 UJ 2 • 24 HRSIIIIHRS • 48 •:• 7'2 HI:iS S. aureus P. aeruginosa Bacillus E.coli 3.9 0.5 1.2 1.3 3.9 0.9 1.5 4 1 1.5 1.1 Figure 1. D-values obtained in lotion A using saline suspensions from 24-, 48-, and 72-hr TSALT cul- tures of S. aureus and E. coli.

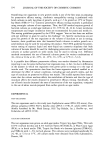
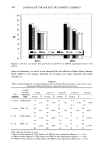
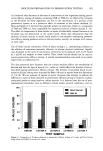
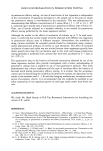
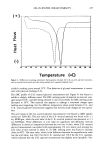
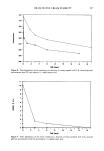
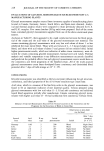
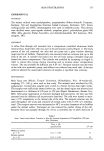
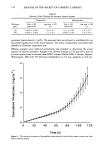
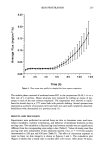
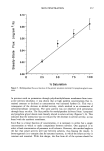
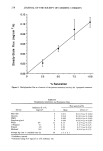
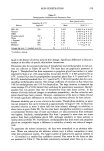
198 JOURNAL OF THE SOCIETY OF COSMETIC CHEMISTS Table II pH of Culture Media After Inoculation With the Test Organisms and Incubation for 24 hr at 37øC Test organism Medium S. aureus P. aeruginosa B. subtills E. coli TSALT 8.2 8.1 8.1 8.3 TSB 5.3 7.4 6.4 5.7 TSB(-G) 7.1 7.6 7.1 7.0 TSB (uninoculated control) = pH 7.2 Table values are pH readings made on the surface of TSALT and in filter-sterilized broth media. growth of these organisms reduced the oxidation/reduction potential, thereby causing the organisms to ferment the glucose with the production of organic acids that reduced the pH. Members of the genus Bacillus are generally considered to be aerobic however, B. subtills is capable of anaerobic growth and weak fermentation in complex media containing glucose (15). The data in Table II show that B, subtills decreased the pH of TSB to pH 6.4 after growth for 24 hr. The genus Pseudomonas is "respiratory, never fermentative" (16). Thus, pseudomonads dissimilate carbohydrates without production of sufficient organic acids to decrease the pH of the culture medium. The data in Table II also show that growth of the test organisms for 24 hr in TSB(-G) did not produce sufficient acid to decrease the pH of the medium, because all cultures had pH values •7.0 at 24 hr. Thus, the presence of a readily utilizable carbohydrate, such as glucose, has an effect on metabolism and acid production in broth cultures of some test organisms. The composition of these culture media is given in Table III. The substantial drop in pH produced by S. aureus and E. coli in TSB suggested that the effect of glucose concentration on acid production by these organisms should be deter- mined. The data presented in Figures 2 and 3 show the pH values obtained after 24 and 48 hr growth of these organisms in TSB(-G) with 0-5% glucose. Both organisms produced the minimum pH at 24 hr when grown in TSB(-G) containing 3% glucose [TSB( + 3% G)]. Continued incubation for another 24 hr resulted in further decreases Table III Composition of TSA, TSALT, PCA, TSB, and TSB(-G) Ingredients TSA TSALT PCA TSB TSB(-G) Pancreatic digest of casein 15 15 5 17 17 (Tryptone Trypticase) Papaic digest of soybean meal 5 5 -- 3 3 (Soytone) Sodium chloride 5 5 -- 5 5 Agar 15 15 15 -- -- Yeast extract -- -- 2.5 -- -- Dextrose (glucose) -- -- 1 2.5 -- Dipotassium phosphate -- -- -- 2.5 2.5 Tween 80 (polysorbate 80) -- 0.5* -- -- -- Lecithin -- 0.07' -- -- -- Table values in g per liter of medium. * Supplements to dehydrated TSA.
Purchased for the exclusive use of nofirst nolast (unknown)
From: SCC Media Library & Resource Center (library.scconline.org)