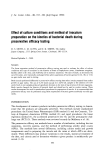
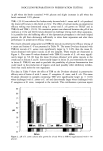
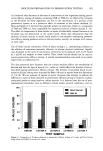
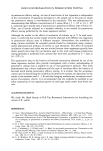
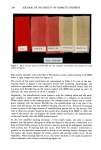
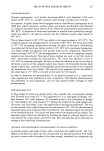
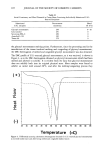
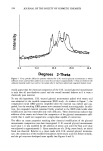
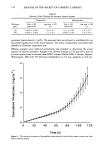
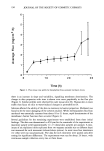
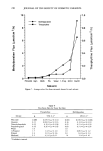
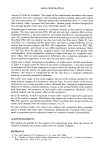
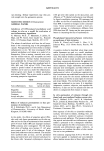
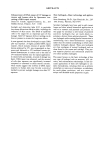
INOCULUM PREPARATION IN PRESERVATION TESTING 199 in pH when the broth contained •4% glucose and slight increases in pH when the broth contained 42% glucose. TSB( + 3% G) was selected for further study because both S. aureus and E. coli produced the lowest pH values in this broth at 24 hr. The effect of culture media on preservative efficacy testing was determined using S. aureus and E. coli grown on TSALT and in TSB(-G) and TSB(+ 3% G). No consistent pattern was observed between the pH of the medium at 24 hr and the D-values obtained in challenge testing with these organisms. It is possible that the buffering effect of the dipotassium phosphate in the broth helped prevent the pH from decreasing sufficiently to stress these organisms and alter their performance in preservative efficacy testing. The results obtained using saline and TSB(-G) inocula in preservative efficacy testing of a cream and lotions C-F are presented in Table IV. The mean D-values obtained with TSB(-G) inocula of S. aureus were significantly larger (p 4 0.05) than the mean D- values obtained with saline inocula in all test samples. These results are illustrated in Figure 4. The mean D-values obtained with TSB(-G) inocula of E. coli were signifi- cantly larger (p 40.10) than the mean D-values obtained with saline inocula in the cream and in lotions C and F, directionally larger in lotion D, and essentially the same in lotion E. TSB(-G) was used to preclude the possibility of glucose fermentation that could result in the production of organic acids (and possibly other inhibitory metabo- lites) that could stress the test organisms. The data in Table V show the effect of TSB on the D-values obtained in preservative efficacy tests of lotion A with S. aureus, P. aeruginosa, B. cereus, and E. coli. The mean D-values obtained in samples containing TSB were significantly larger (p = 0.05) when challenged with S. aureus or E. coli and directionally larger when challenged with P. aeruginosa or B. cereus, compared to the controls. This corroborates a previous report _ 8 7 6 5 4 3 2 1 24hrs 48hrs Figure 2. pH of S. aureus cultures after growth for 24 and 48 hr in TSB(-G) supplemented with 0-5% glucose.

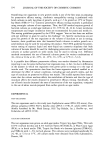
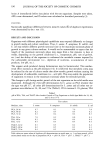
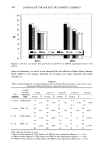
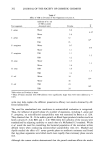
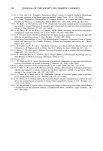
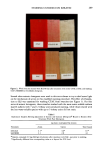
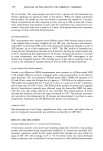
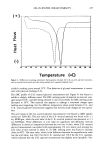
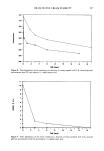
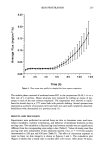
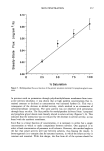
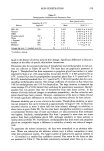
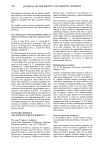
200 JOURNAL OF THE SOCIETY OF COSMETIC CHEMISTS pH 7' 6 5 4 3 2 1 0 24hrs 48hrs Figure 3. pH of E. coli cultures after growth for 24 and 48 hr in TSB(-G) supplemented with 0-5% glucose. from our laboratory, in which it was observed that the addition of Brain Heart Infusion Broth (BHI) to test samples increased the D-values over those obtained with saline inocula (3). Table IV Effect of Growth Medium and Suspending Liquid on D-Values Obtained Using S. aureus and E. coli in Preservative Efficacy Testing of a Cream and Several Test Lotions Growth medium/ Cream Lotion C Lotion D Lotion E Test suspe_9_nding o[iN•ms liq•iid D-value X D-value X D-value X D-value X Lotion F S. aureus TSALT/saline 15 20 14 5.4 9.2 15' 21'* 14' 5.8* 15 22 14 6.2 6.5 S. aureus TSB(-G) 60 94 49 10 20 63* 86** 52* 10' 65 78 55 10 19 E. coli TSALT/saline 22 55 5.1 11 45 21'* 58** 5.3 12 20 60 5.4 12 42 E. coli TSB(- G) 47 86 9.0 12 60 44** 84** 7.6 11 40 80 6.2 10 53 20** 44*** 57*** Table values are D-values in hours. * Mean D-values obtained in TSALT/saline and TSB(-G) were significantly different (p = 0.01). ** Mean D-values obtained in TSALT/saline and TSB(-G) were significantly different (p -- 0.05). *** Mean D-values obtained in TSALT/saline and TSB(-G) were significantly different (p = 0.10).
Purchased for the exclusive use of nofirst nolast (unknown)
From: SCC Media Library & Resource Center (library.scconline.org)