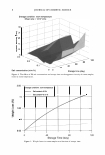
16 JOURNAL OF COSMETIC SCIENCE a series of publications on fragrance evaporation (16) and by Santos and co-workers in a study of evaporation of vegetable oil emulsion with lamellar liquid crystal phases (17). However, in spite of the rich information available, it appears that one essential factor has only received scant attention. During the evaporation of emulsions, new structures appear, even for the simplest of emulsions (18). So far these structures have not received notable attention. One possible reason for this negligence may be the complexity of the phase changes taking place during the evaporation of a typical skin lotion emulsion (19). This complexity may be the main reason for the paucity of publications utilizing phase diagrams to estimate structural changes during evaporation. The application of phase diagrams is not widely accepted within the cosmetic formulation community. However, there is no reasonable doubt that the structural changes during evaporation are of central importance for the action on the skin. With this fact in mind, we found a less elaborate process than determining phase diagrams to be of interest to obtain some essential information about evaporation changes in skin care emulsions during evapo ration. In order to make the investigation highly realistic, the present contribution reports the changes during evaporation in a commercial emulsion of unknown compo sition, utilizing only generally available equipment: an optical microscope and a cen trifuge. The simple experiments gave surprisingly essential information about the changes taking place. EXPERIMENT AL The present experiment followed the methodology of emulsion evaporation on micro scopic slides done by Santos et al. (17), who did some modifications from the one done by Friberg and his collaborators (18). A drop of the commercial emulsion was deposited onto an area on a microscope slide limited to 6.9 cm2 . The thickness of the layer was kept at 0.2 mm. The evaporation loss versus time was measured using a balance (Mettler P160N) equipped with an infrared lamp at 70°C. At each 10% of weight loss, until 90%, the microphotos of the sample were obtained in an Olympus microscope (Model BX 50) equipped with polarizers. The drop-size distribution in the emulsions was analyzed by manual measurements of the drop sizes in the microscopy photos. This information was complemented by centrifugation. In the first instance, the original emulsion was centrifuged. In a second experiment, a thin layer of the emulsion was spread in a Petri dish and, guided by the results of the microscopy, it was evaporated until 80% of the initial weight remained. The remainder was gathered into an Eppen dorf test tube and centrifuged at 16.100 ref (Eppendorf Centrifuge 5415R) and at 20.400 ref (Eppendorf Centrifuge 5417R) until maximum separation occurred. Each layer was photographed in the microscope both between crossed polarizers and in iso tropic light. The original emulsion was centrifuged in the same manner. RESULTS The results will be reported in the following order. At first the microscopy photos for the emulsion after certain percentages of evaporation will be viewed to detect the initiation of essential changes in the structure. Secondly, the gross structures after centrifugation of both the original emulsion and the one evaporated to 20% of the

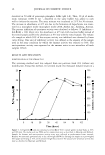
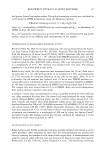
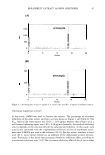
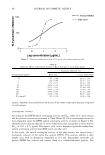
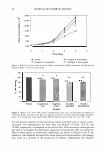
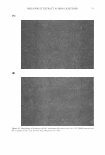
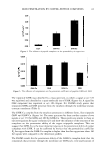
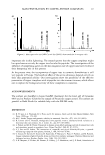
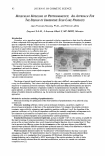
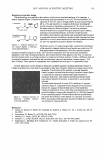
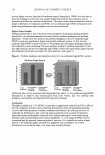
CHANGES DURING EVAPORATION OF EMULSION 17 original amount will be presented and the microscopy photos of the layers observed. Thirdly, the number distribution of drop size will be given to establish the degree of flocculation and coalescence. The emulsion per se (Figure la) shows a "normal" distribution of drop sizes, and does not contain any birefringent material (Figure lb). The determination of the drop sizes by manual measurement on the microphoto shows a predominance of drops of a diameter of 1. 75 µm, with substantial tails towards both larger and smaller drops (Figure 2). Centrifugation of the emulsion did not give complete separation into clear phases. Instead, three layers were found (Figure 3). The calculation of the volume of the three layers is complex. Due to the geometry and details of the calculation, the reader is referred to two appendices (Appendix I and Appendix II). The volumes of the layers are presented in Table I. The dispersion structure in the different layers is disclosed by the microscopy photos (Figure 4). The first feature to be observed is the absence of birefringent material the photos taken with the sample between crossed polarizers were all black and have not been included. The top emulsion layer is similar to the entire emulsion (Figure 1). The drop size distribution is similar, but the emulsion, as expected, contains a signifi cantly greater amount of dispersed material, and there are strong indications of frequent flocculation. Obviously the emulsion shows good stability against coalescence. The middle layer contains a dilute emulsion with characteristics similar to those of original emulsion, but now, in addition, there are particles present. These are easily distinguished from potential coalesced drops because of their shape, with discrete edges. These particles are more prevalent in the bottom emulsion layer (Figure 4c). These results give essential information about the emulsion. It consists of an oil phase that is lighter than water, and in addition, it contains particulate matter of a density slightly greater than that of water. This information is now related to the changes during evaporation. These changes during evaporation are of two kinds. The first one is found in the initial stage of evaporation, while the second appears first, when a predominant part of the emulsion is already evaporated. The first stage is characterized by an increase in the number of drops, as illustrated by the difference between the features of the emulsion in Figure 1 and those in Figure 5. There is an obvious increase in the number of drops, mainly smaller drops or even particles. As far as the larger drops are concerned, the size distribution remains the same (Figure 2). The alteration at later stages of evaporation is exemplified by the modification of the features in Figure 1 to those in Figure 6. The decisive changes are initiated in the emulsion after 70% of evaporation (Figure 6a,b). The original features of individual drops are now replaced by a pattern of heavily coalesced drops only, at less evaporation (Figure 6a), and in addition there are small amounts of anisotropic material found (Figure 66). These new emulsion traits are the predominant ones after 80% evaporation, in contrast to those found at 40% evaporation (Figure 2) and in the original emulsion, with well-defined drops now replaced by an assembly of irregular drops or particles. In addition, anisotropic material is now prevalent (Figure 6d). As to the structure of the anisotropic material, the photo does not provide an answer it may be a crystal or a liquid
Purchased for the exclusive use of nofirst nolast (unknown)
From: SCC Media Library & Resource Center (library.scconline.org)