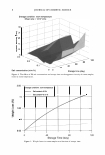
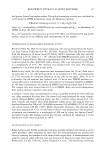
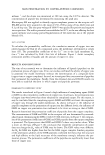
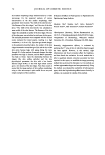
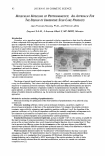
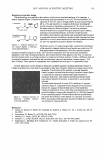
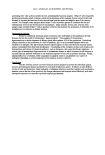
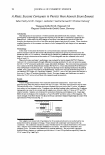
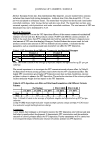
6 10 - 8 "' �L II - 'in 6 "' · - 4 C: - � a. 2 - 0 I 0.00 JOURNAL OF COSMETIC SCIENCE I I 0.05 I :::::c:: I I =-== :::::c:: - I I I 0.10 0.15 I Storage time = one weak Storage conditions: room temp. Shear rate= 20.65 (1/s) I I I 0.20 Salt concentration (w/wo/o) J[ 0.25 Figure 2. Error bars of the apparent viscosity of the prepared creams measured at shear rate = 20.65 (11sec). move toward the negatively charged layer. This results in an increase in the ionic strength of the negatively charged layer and subsequently capturing more water mol ecules in the void space between the aggregated oil droplets. This may explain the increase in the viscosity of the cream upon the addition of salt. The appearance of maximum viscosity may be explained by the concentration at a certain salt level where a maximum capacity of the layer for the anionic charge is reached. As more DS salt is added, positively charged ions (e.g., Na+, Mg+2 ... ) start neutralizing some of the negative charge. This action results in a weaker bridge, resulting in water molecules with lower attraction. Thus, the oil droplets will have a greater tendency to coalesce, resulting in a reduction in the apparent oil-phase volume. The viscosity reduction of the body cream samples is the result of a decrease in the apparent phase volume of the dispersed droplets. The explanation for the appearance of two maxima in the apparent viscosity at 0.07 and 0.15 wt% DS salt concentration (see Figure 1) might be attributed to the presence of different ions (e.g., Mg +2 , Ca +2 , K+, Na+, ... ) with different ionic strength in the added DS salt. Silvander et al. (9) investigated the effects of electrolyte addition to a cosmetic emulsion. Monovalent sodium chloride had practically no influence on viscosity. Cal cium chloride, on the other hand, had a large impact on viscosity, even at low concen trations. The resulting increase in viscosity was due to flocculation that led to an increase in apparent phase volume. A similar behavior was obtained with magnesium chloride, with the difference that the maximum in viscosity was shifted to higher electrolyte concentrations. This was interpreted as such because magnesium bound more strongly to the hydration water than did calcium.

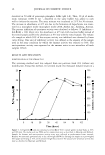
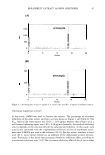
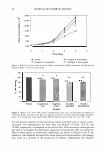
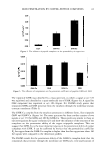
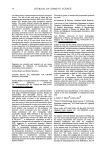
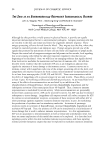
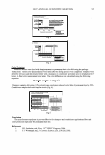
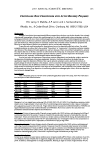
DEAD SEA SALTS IN COSMETIC EMULSION 7 An additional point of interest is the decrease in viscosity when the salt concentration increased from 0.0 to 0.05 wt%. This small effect is due to the decrease in electrostatic screening length and is often referred to as a secondary electroviscous effect (9). One the other hand, a decrease in the apparent viscosity of body cream samples with different DS salt concentrations was observed as the shear rate was increased (see Figure 1). This implies that the cream behaves like a shear thinning material. Figures 3 and 4 show the effect of DS salt on apparent viscosity for samples stored at room temperature at different storage periods. It can be clearly observed that the apparent viscosity of cream samples increased with storage time and that this effect was more pronounced at high storage time (two and three months). In a similar study, Korhonen et al. (3) studied the effect of storage time on the rheological behavior of creams with four different surfactant combinations. They found that the viscosity (con sistency) of the cream decreased during storage, suggesting that other factors have affected our creams in the increase of viscosity with storage time. This phenomenon can be attributed to the evaporation of water from the emulsion. Evaporation of the water continuous phase causes compression of the emulsion, with progressive distortion of the oil drops and thinning of the water films separating them (10). To verify this result, the weight of two cream samples, one with DS salt and one salt-free, was observed. As can be seen in Figure 5, the weight of the cream samples decreases with storage time because of water evaporation. It is interesting to see in Figure 5 that the rate of water evaporation decreases in the presence of DS salt. This can explain the results presented in Figure 4, where the salt-free sample exhibits maximum viscosity after three months of storage. 60 --,-----------------.----------- Storage condition: room temperature Shear rate= 4.45 (1/s) storage time: - "' cti E!::., 40 � 'cii "' · � 20 C. C. EJ One week Two months 0 -1--- -r---.----.----,------,,------,,------,,------,,------,------, 0.00 0.05 0.10 0.15 Salt concentration (w/w % ) 0.20 0.25 Figure 3. The effect of DS salt concentration on the apparent viscosity of cream samples stored for different periods at room temperature.
Purchased for the exclusive use of nofirst nolast (unknown)
From: SCC Media Library & Resource Center (library.scconline.org)