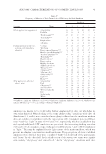
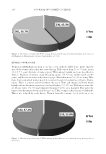
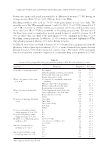
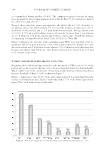
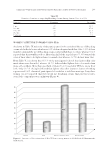
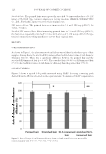
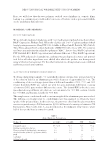
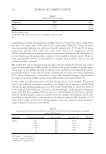
SENSORY CHARACTERIZATION OF COSMETIC EMULSIONS 91 emulsions are known to be sticky/tacky, further emphasized by olive oil, which has its own tacky skin feel. When looking at the term “gluey/sticky,” emulsions with olive oil (Emulsions 2, 4, and 6) were considered more gluey/stickier than the emulsions without olive oil, which is in alignment with the expectations (28). Consumers perceived Emul- sions 3 and 4 as “light” at rates of 90% and 76%, respectively, which is usually how liq- uid crystal–stabilized O/W emulsions are perceived. An interesting fi nding was that 74% and 61% of consumers, respectively, perceived Emulsions 5 and 6 (W/O emulsions) as “light.” This may be explained by the light nature of the main emollient, which was present in a higher concentration in all emulsions. The perceptions of steric-stabilized emulsions were divided they were considered “light” by about half of the participants and “heavy” by the other half. In the third section of the survey, two terms were signifi - cant, namely “oily/greasy” and “smooth/soft.” As for “oily/greasy,” emulsions with olive Table V Frequency of Mention of Each Term of the CATA Survey for Each Emulsion Category Term Emulsion 1 2 3 4 5 6 Before application (appearance) Glossy/shiny 36 33 39 41 39 41 Dull/fl at 10 10 4 3 5 6 Thick/creamy*** 49 45 15 27 0 6 Thin/milky*** 1 1 31 18 49 43 Bright white 33 34 33 35 28 33 Off-white 11 8 6 8 14 10 During application (rub-out, pick-up, and immediate afterfeel) Cooling 23 25 27 27 33 28 Warming 2 2 0 1 1 1 Easy to spread/slippery*** 36 38 48 49 45 38 Hard to spread/dragging*** 7 7 0 0 4 13 Thick/creamy/fi rm*** 39 39 2 6 2 10 Thin/milky*** 7 3 39 35 40 31 Hard to rub in* 16 9 13 17 12 23 Easy to rub in 29 28 28 25 29 19 Highly absorbent 19 17 10 17 14 14 Slightly absorbent 18 18 20 22 22 18 Watery/wet*** 9 6 39 25 33 22 Oily/greasy*** 27 28 6 13 14 19 Silky/smooth* 32 24 38 32 24 29 Gluey/sticky*** 11 15 1 4 7 13 Light*** 18 19 45 38 37 31 Heavy*** 22 16 0 4 3 10 After application (afterfeel after 3 min) Glossy/shiny 25 24 23 29 29 27 Dull 14 10 15 11 10 14 Oily/greasy** 20 24 8 16 13 16 Smooth/soft** 36 27 44 34 29 32 Wet/not fully dry 16 19 10 14 19 15 Dry 21 16 20 21 18 20 Sticky/tacky 7 12 3 10 7 11 White 4 4 4 2 2 1 ***Indicates signifi cant differences ( p 0.001) **Indicates signifi cant differences ( p 0.01) *Indicates sig- nifi cant differences ( p 0.05), according to Skillings–Mack test.

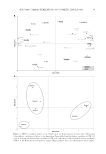
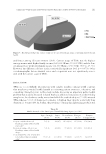
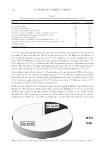
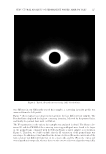
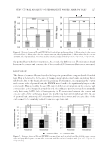
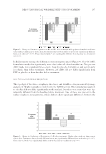
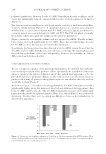
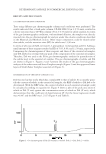
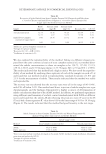
JOURNAL OF COSMETIC SCIENCE 92 oil were considered oilier, which can be expected because of olive oil’s tacky nature. The emulsions without olive oil had the highest frequencies of mention for “smooth/soft,” which makes sense, considering that emulsions with olive oil were considered “oily/ greasy” and “sticky/tacky.” Antonym terms, for instance “thick/creamy” and “thin/milky,” “easy to spread/slippery” and “hard to spread/dragging,” and “light” and “heavy,” are examined next. Instances of individual consumers selecting both ‘attribute A’ and ‘not attribute A’ were uncommon (3%), which suggests that most of the consumers understood the terms, were attentive of fi lling out the survey, and did not randomly select terms, which correlates with prior fi nd- ings (20,29). These examples clearly suggest that term selection for the CATA survey was appropriate, as consumers were able to detect differences based on the emulsions’ sensory characteristics. Our fi ndings also suggest that CATA surveys can serve as a useful tool in the product development process when formulators have multiple viable prototypes for a particular product. Recruiting consumers from the target group and having them fi ll out a CATA survey can be an easy, fast, and convenient approach for companies and can provide guid- ance for formulators as to which prototype(s) should be moved into the subsequent steps of product development. MFA The MFA with balancing sets of variables explained 72.16% of the total inertia in the fi rst two dimensions (Figure 2). With such a high explanatory power, it was worth repre- senting the results in a reduced dimensional space, where it was possible to examine visu- ally associative links among groups of variables. Contributions represent the extent to which each variable contributes to building the corresponding axis, which helps in the interpretation. A variable with a large value contrib- utes more to the defi nition of the specifi c dimension. Contributions (CTR) are shown in Figure 2A in three colors. Terms in black had the highest contribution (CTR 8), terms in medium gray had medium contribution (CTR 3–8), and terms in light gray had the lowest contribution (CTR 3). The following variables contributed to the fi rst dimen- sion the most: “glossy/shiny (appearance),” “dull/fl at (appearance),” “thick/creamy (appearance),” “think/milky (appearance),” and “oily/greasy (afterfeel).” As for the second dimension, the following variables contributed the most: “bright white (appearance),” “off-white (appearance),” “glossy/shiny (afterfeel),” “dull (afterfeel),” “smooth/soft (after- feel),” and “wet/not fully dry (afterfeel).” From the results, it seems that consumers per- ceived dull creams as smooth/soft and off-white as glossy/shiny. Figure 2A shows the representation of terms of the CATA survey in the MFA dimensions. Correlation shows the relationship between the variables (i.e., terms of the CATA survey). The terms “thick/creamy/fi rm,” “oily/greasy,” “oily/greasy (afterfeel),” “warming,” “dull/ fl at,” “heavy,” “thick/creamy,” “gluey/sticky,” and “highly absorbent” had a correlation of 0.8 or higher in the fi rst dimension, whereas “easy to spread/slippery,” “thin/milky,” “glossy/shiny,” “watery/wet,” “light,” and “thin/milky (pick-up and rub-out)” had a cor- relation of -0.8 or lower in the fi rst dimension. Consumers felt that light creams were easy to apply, wetter than heavy creams, and thin and glossy, whereas heavy creams were
Purchased for the exclusive use of nofirst nolast (unknown)
From: SCC Media Library & Resource Center (library.scconline.org)