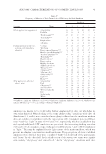
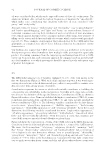
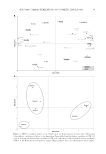
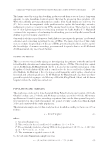
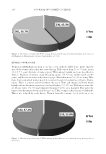
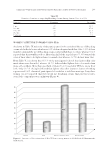
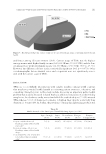
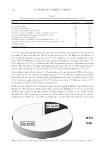
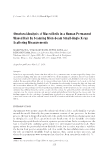
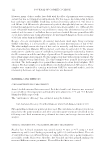
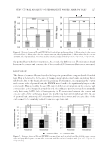
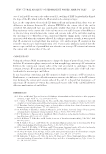
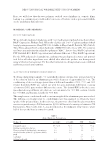
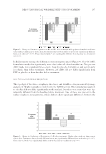
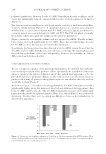
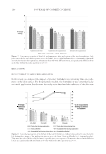
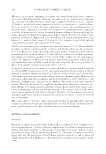
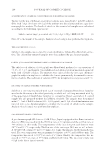
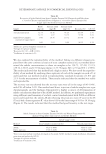
SENSORY CHARACTERIZATION OF COSMETIC EMULSIONS 95 at the positive values of the fi rst dimension and negative values of the second dimen- sion, being described by consumers as bright white, thick/creamy, and easy to rub-in. On the other hand, Emulsion 5 was located at the negative values of the fi rst dimension and positive values of the second dimension. It was described as cooling, glossy/shiny, and thin/milky. These results are in agreement with the viscosity measurements. The afterfeel characteristics also had a large discriminative power, which helped differenti- ate Emulsion 3 from Emulsion 5. Consumers felt that Emulsion 3 left their skin smooth/soft and dull, whereas Emulsion 5 made the skin glossy/shiny 3 min after application. We also looked at which ingredient types were driving the skin feel and sensory charac- teristics, and how these were related to each other. Five supplementary groups of variables were added to the empirical investigation. They expressed the percentage of emollients, emulsifi ers, water, and other ingredients in the emulsions, as well as the measured viscos- ity. One of the main purposes of factorial analyses is to make predictions via displaying external profi les in a created map. Thus, supplementary variables were not included in constituting the plane but their relative position and relationship with the factors were shown geometrically. The results showed that the sensory characteristics were primarily driven by the emulsifi ers, not the emollients. These fi ndings empirically verify previous fi ndings (21,22). Figure 3 shows that water and the emulsifi ers are strongly related to the main factor. This factor has a strong inertia for two other clouds of variables, including appearance and pick-up/rub-out, meaning that numerous variables from these groups are related to this common factor. On the other hand, the relationship of emollients with both factors was statistically weak, as is shown by their location in the MFA dimensions. The other ingredients, including the humectant and preservatives, did not have any cor- relation to the skin feel characteristics at all because they were used in the same concen- tration in each emulsion. Viscosity had a high correlation with the emulsifi ers and water, suggesting that viscosity is determined by both of these ingredients (Figure 3). Viscosity was closely located to pick-up/rub-out, which indicates that viscosity has an important role in infl uencing these skin feel characteristics. On the other hand, the location of afterfeel and viscosity are far- ther from each other, suggesting a weaker relationship. Cluster analysis. HCA under MFA was performed using two types of distance metrics (including Manhattan and Euclidean) and four agglomeration methods (including aver- age, complete, single, and Ward linkage). All dissimilarity measures with both cluster methods resulted in the same classifi cation (Figure 2B). The fi rst cluster was composed of Emulsion 3. The second cluster included Emulsions 4, 5, and 6, and the third cluster was composed of Emulsions 1 and 2. According to this analysis, consumers categorized emul- sions slightly differently as compared with the original grouping based on emulsion type (i.e., steric-stabilized O/W, liquid crystal–stabilized O/W, and W/O). Consumers grouped the steric-stabilized emulsions together. These emulsions were the thickest, considered “heavy” by consumers, and very dissimilar compared with the rest of the emulsions. The second group included two W/O emulsions and the liquid crystal–stabilized O/W emul- sion with olive oil. The fact that two different types of emulsions, both containing olive oil, were grouped together suggests that consumers could detect similarities between these two products. This is a notable result, especially when we consider that the partici- pants were untrained consumers.

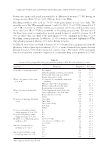
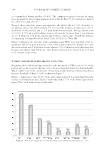
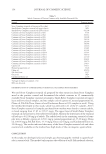
JOURNAL OF COSMETIC SCIENCE 96 Looking at the results of the cluster analysis also helps to defi ne the fi rst dimension more accurately. A possible explanation for having three emulsions in this cluster is that con- sumers differentiated emulsions primarily based on the sensation of viscosity on applica- tion (i.e., under shear) and not just thickness as an attribute of appearance. Discriminating samples based on viscosity is not an easy task. According to a recent study (31), the abil- ity to discriminate viscosity differences is attributed to experience. As mentioned previ- ously, 74% of our participants were regular users of hand and body lotions. They more likely noticed differences in the sensation of viscosity. As mentioned previously under the frequency of mention of the terms, Emulsions 3 and 4 were regarded as “thin” in terms of rub-out and pick-up properties (during application) by the majority of consumers (78% and 70%, respectively). This also helps to explain the three-emulsion cluster. These ob- servations are in correlation with the fi ndings of the MFA. Cluster analysis also helped to defi ne the second dimension. We compared all possible combinations of each emulsion in pairs (Table VI). We looked for attributes that were related to either appearance or afterfeel and were similar for Emulsions 4 and 6, but dif- ferent for Emulsions 3 and 5. The reason for this was that we wanted to identify attri- butes that could help better understand the second dimension. We identifi ed two attributes, namely “off-white” and “wet/not fully dry.” This confi rms the fi ndings of the MFA that the second dimension was mainly related to the appearance of the emulsions, including color and afterfeel after 3 min, including watery feeling provided by the emulsions. Figure 3. Representation of ingredient types and skin feel characteristics.
Purchased for the exclusive use of nofirst nolast (unknown)
From: SCC Media Library & Resource Center (library.scconline.org)