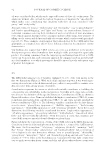
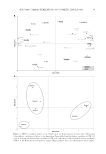
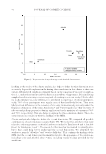
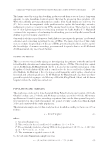
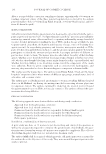
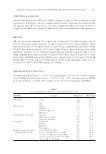
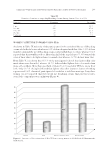
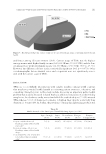
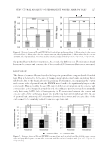
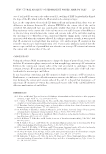
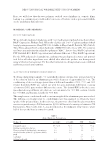
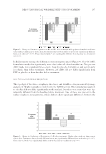
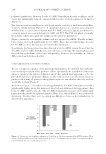
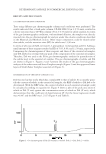
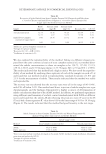
DETERMINATE SAFROLE IN COMMERCIAL ESSENTIAL OILS 151 COMPARISON OF OUR METHOD TO THE AOAC METHOD To examine the accuracy of the proposed method for safrole measurement, safrole contents in the oil samples were measured by the AOAC method and by our method. With the AOAC method, the safrole levels in a Stout Camphor essential oil sample (S1) and a natural Figure 4. Calibrat ion curve of safrole to DA. Figure 3. Gas chr omatogram of (A) Small-fl ower Camphor (C. kanehirai Hayata) essential oil (upper layer) and (B) Small-fl ower Camphor essential oil (lower layer). Peak 1 = DA Peak 2 = safrole.

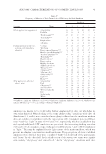
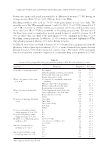
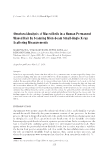
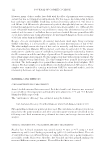
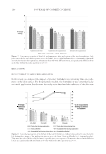
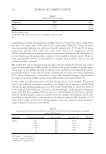
JOURNAL OF COSMETIC SCIENCE 152 peppermint oil sample obtained from a market were 36.23 and 24.01 mg/g, respectively, and the CV% values were 5.89% and 6.11%, respectively (Table IV). Using our direct injection method, however, the safrole levels in the samples were 37.65 and 35.28 mg/g, respectively, and the CV% values were only 3.62% and 2.73%, respectively. As the AOAC method requires sample pretreatment with steam distillation and chloroform ex- traction before gas chromatographic analysis, 4 h are needed to obtain a result. However, with our proposed method, no pretreatment is needed, and, therefore, only 25 min are needed to analyze a sample. The small CV% values obtained using our direct injection method indicated that it has a higher accuracy than the AOAC method. In addition, the greater number of sample prepa- ration steps in the AOAC method, including steam distillation and chloroform extrac- tion, might lead to a lower yield of safrole, resulting in lower detection values and higher CV% values. Furthermore, chloroform is a toxic and controlled reagent, which renders the application of the AOAC method more diffi cult than our method (Table V). In this study, we performed tests to validate the specifi city of our method. The process used 0.1-μl solutions of reference standards, test samples, and a negative control (blank solvent) in a gas chromatographic protocol. The results showed that no safrole was detected in the negative control (Figure 3A) and no chromatographic peaks appeared during the range of the RT. This confi rmed that the negative control (blank solvent) did not interfere with the chromatographic analysis of safrole in the test samples and standards, which indi- cated that our method had a good specifi city. In addition, near the RT of safrole (11–14 min), only a single symmetrical chromatographic peak was observed, demonstrating a single compound consistent with the RT. Table I RRF and GC RT of Safrole Compound RRFa RTb DAc 1.000 11.356 Safrole 1.207 11.809 a RRF of safrole to DA. b A CP-SIL 8 CB column (0.53 mm × 30 m, DF=1.0 μm) was used. c I S. Table II Lowest quantitatively Determinable Concentration of Safrole by Gas Chromatography equipped with an FID Detector Compound Concentration (μg/ml) Detectabilitya Recovery (%)b RSD (%)c Safrole 50.0 Yes 103.8 3.8 25.0 Yes 102.5 3.5 10.0 Yes 98.1 5.8 5.0 Yes 110.7 10.9 2.5 Yes 122.8 18.5 1.0 No — — a FID range = 2, attenuation = 2. b Average of triplicate analyses. c Coeffi cient of variation (cv%).
Purchased for the exclusive use of nofirst nolast (unknown)
From: SCC Media Library & Resource Center (library.scconline.org)