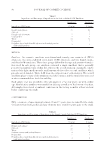
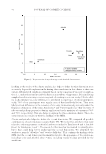
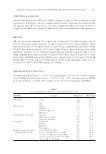
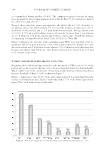
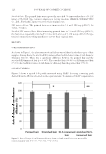
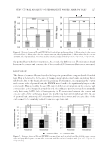
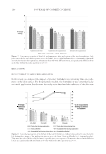
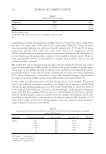
SENSORY CHARACTERIZATION OF COSMETIC EMULSIONS 89 PHYSICAL EVALUATION OF THE EMULSIONS A Discovery Hybrid Rheometer DHR-3 (TA Instruments, New Castle, DE) was used for measuring rheological properties of the different emulsions. A 40-mm 2° cone and plate geometry at 25.0° ± 0.1°C tested samples of 0.8 ml. Steady state viscosity was recorded at various shear rates (Table IV). DATA ANALYSIS Frequencies of mention for each term were determined by counting the number of par- ticipants that used a term to describe each emulsion. The Skillings–Mack test, which is the general form of the Friedman test (23), was implemented in STATA (StataCorp LLC, College Station, TX) for each term (within-subjects variable), considering samples (dependent variable) as the sources of variation to evaluate whether the CATA survey was able to detect differences in consumers’ perception of the evaluated cosmetic emulsions. The robustness of the Skilling–Mack test was evaluated with a Cochran’s Q test (24). Hierarchical cluster analysis (HCA) was carried out on the CATA survey to identify groups of emulsions that shared similar preferences based on consumers’ opinions (25). A multiple factor analysis (MFA) was performed on the frequency table containing re- sponses to the CATA survey to investigate the relationship between the six emulsions and the 30 terms used in the CATA survey (26). All factorial analyses were performed using R language (R Core Team, 2013). Emulsions were compared in pairs using a two-sample analysis of variance (ANOVA) test. RESULTS AND DISCUSSION VISCOSITY MEASUREMENTS The viscosity of each emulsion is reported at a single shear rate (1 s-1) and varied more than 10-fold (Table IV). Emulsions 1 and 2 contained cetyl alcohol as a co-emulsifi er. Because of the waxy nature of cetyl alcohol, this component also acted as a thickener, in- creasing the viscosity of the emulsions. Emulsions 3 and 4 contained a combination of sorbitan stearate and sorbityl laurate, an off-white, fl aky ingredient that produced emul- sions with a self-bodying effect (27). Emulsions 5 and 6 contained two liquid emulsifi ers, which did not add to the viscosity of the emulsion. Table IV Viscosity of Each Emulsion at 1 s-1 Sample Viscosity (mPa·s) Emulsion 1 17,500 Emulsion 2 17,500 Emulsion 3 6,100 Emulsion 4 8,000 Emulsion 5 1,200 Emulsion 6 1,800

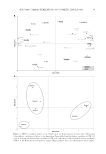
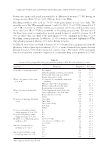
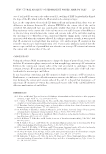
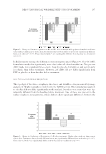
JOURNAL OF COSMETIC SCIENCE 90 Viscosities were very similar for the same types of emulsions (i.e., Emulsions 1 and 2, Emulsions 3 and 4, and Emulsions 5 and 6), because only the emollients, which were both liquid ingredients, differed. Thus, the presence of olive oil did not change the vis- cosity of the thickest emulsion (Emulsion 1), whereas modestly increasing the viscosity of the other two emulsion types. CATA SURVEY Frequency of mention of terms. Table V shows the number of consumers who used terms of the CATA survey to describe each of the evaluated cosmetic emulsions. As for the appear- ance of the emulsions, most emulsions were considered “glossy/shiny” and “bright white.” Regarding the viscosity of the emulsions, term selection depended on the particular sam- ples. Emulsions 1 and 2 (i.e., steric-stabilized O/W emulsions) had a high viscosity they were thick creams and did not fl ow in the container. They were perceived as “thick/ creamy” by most consumers, which was in line with the viscosity measurements discussed previously. Emulsions 3 and 4 (i.e., liquid crystal–stabilized O/W emulsions) had a me- dium viscosity, compared with the rest of the emulsions. Perception of their viscosity was not uniform unlike in the case of the other emulsions, most of the consumers considered Emulsion 3 as “thin/milky,” whereas Emulsion 4 was perceived primarily as “thick/creamy.” Consumers could not decide whether they should select “thick/creamy” or “thin/milky.” Some consumers noted that they perceived the viscosity to be “in between” the two terms. Notes were not used in the data analysis. Emulsions 5 and 6 (i.e., W/O emulsions) had a low viscosity they were lotions and were able to fl ow easily in the container. These emul- sions were considered “thin/milky” by most of the consumers, which again was in agree- ment with the viscosity measurements. As for the second section of the CATA survey, which was related to rub-out, pick-up, and immediate afterfeel, the terms “easy to spread/slippery,” “light,” “gluey/sticky,” “cooling,” “light,” “silky/smooth,” and “easy to rub in” were most frequently associated with the evaluated emulsions. The least mentioned terms were “warming” and “hard to spread/ dragging,” suggesting that most consumers thought none of the evaluated emulsions had these properties. Regarding the afterfeel after 3 min, which was the third section of the CATA survey, the most frequently selected terms were “smooth/soft,” “glossy/shiny” and “dry.” The least mentioned term was “white.” Results of Cochran’s Q test, which was performed to evalu- ate the robustness of the Skillings–Mack test, were identical to those of the Skillings– Mack test. Statistical analysis showed signifi cant differences for 15 of the 30 terms of the CATA survey (Table V), which suggests that the CATA survey was able to detect differ- ences in consumers’ perception of the emulsions. In addition, all three categories had statistically signifi cant terms, which indicate that consumers were able to distinguish between emulsions based on more than appearance. In the fi rst section of the CATA survey, signifi cant terms were those related to the viscos- ity of the products. Probable rationale includes the following: (i) viscosity is a property that can be qualitatively determined by eye, and (ii) signifi cant viscosity differences were present in the three sets of emulsions. In the second section of the CATA survey, more than half of the terms were signifi cant. For example, most consumers selected “hard to spread/dragging” for Emulsion 6, which was a W/O emulsion containing olive oil. W/O
Purchased for the exclusive use of nofirst nolast (unknown)
From: SCC Media Library & Resource Center (library.scconline.org)