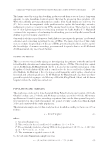
JOURNAL OF COSMETIC SCIENCE 148 QUANTIFICATION OF SAFROLE CONCENTRATIONS IN ESSENTIAL OIL SAMPLES Twenty to fi fty mg of different essential oil samples were mixed with 5 ml of IS solution (DA total 5 mg). A volume of 0.1 μl of the mixture was directly injected into a gas chro- matograph for analysis. The levels of safrole in the essential oil samples were calculated according to the following equation (2): Safrole content (mg / g essential oil) = (AS / AIS) × (WIS / RRF) × 1/W. (2) Here, W is the weight of t he sample. Analysis of each sample was performed in triplicate. THE AOAC METHOD (19,23,24) Safrole in the samples was isolated by steam distillation, followed by chloroform extrac- tion. The chloroform-extracted samples were then analyzed by gas chromatography. LOWEST QUANTITATIVELY DETERMINABLE CONCENTRATION OF SAFROLE The safrole stock solution (1,000 μg/ml) was diluted with methanol to concentrations of 50, 25, 10, 5, 2.5, and 1 μg/ml. One milliliter of each diluted solution was mixed separately with 1 ml of DA IS solution. The mixtures were injected directly into a gas chromato- graph for analysis in triplicate to calculate the lowest quantitatively determinable concen- tration of safrole. The coeffi cient of variation (CV%) for α-terpineol recovery was set at 15%. RECOVERY OF SAMPLES FORTIFIED WITH SAFROLE Safrole at 2 or 10 mg was mixed with 1 g of essential oil prepared from Stout Camphor wood in the laboratory as described previously, or safrole at 1 or 10 mg was mixed with 1 g of the upper layer of Small-fl ower Camphor (C. micranthum Hayat) essential oil. A control sample was also prepared without the addition of safrole. The samples were then mixed with 0.5–5 ml of DA IS solution (100–1,000 μg/ml), and 0.1 μl of each fi nal mixture was injected into a gas chromatograph to calculate the recovery of safrole in the sample. Analysis of each sample was performed in triplicate. GAS CHROMATOGRAPH CONDITIONS A gas chromatograph (GL Sciences 390B, Tokyo, Japan) equipped with a fl ame ionization detector (FID) was used with the H2 fl ow rate at 30 ml/min and the air fl ow rate at 300 ml/min in this study. The temperatures of the injection port and detector were 245°C and 315°C, respectively. The fl ow rate of the carrier gas (N2) was set at 5 ml/min. A CP-Sil 8 CB column (30 m × 0.53 mm i.d./1.0 μm Chrompack, the Netherlands) was used. The oven temperature was programmed to initiate at 80°C and hold for 6 min. The temperature was raised to 120°C at a rate of 6°C/min. Finally, the temperature was in- creased to 300°C at a rate of 35°C/min, and held for 10 min. The injection volume was 0.1 μl in the direct injection mode.

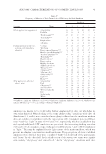
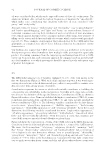
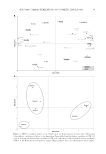
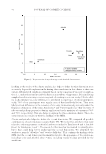
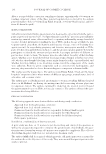
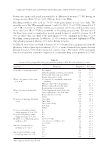
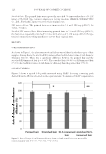
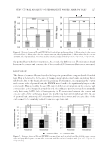
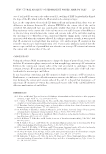
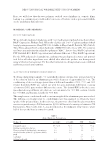
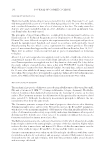
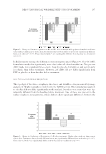
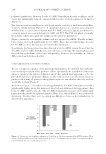
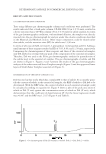
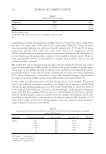
DETERMINATE SAFROLE IN COMMERCIAL ESSENTIAL OILS 149 RESULTS AND DISCUSSION GAS CHROMATOGRAPHY CONDITIONS Tests using different gas chromatography columns and conditions were performed. The results indicated that a weak polar column, CP-SIL 8CB (30 m × 0.53 mm), resulted in a better outcome than a CP-Wax column (30 m × 0.53 mm) for safrole analysis. In terms of the gas chromatography conditions, with methanol dilution, the samples were directly injected into the gas chromatograph for analysis under the column conditions described in the Materials and Methods section. Other major components could be eluted earlier than safrole, and the retention time (RT) for safrole was 13.90 min. In terms of selection of theIS, we tested 1,5-pentanediol, 1,6-hexanediol and DA. Adding a small amount of these reagents resulted in RTs of 5.83, 8.09, and 11.38 min, respectively. Comparing the chromatograms of these reagents and those of the essential oil samples, only DA showed no overlap with any peak of the components of the essential oil samples. Therefore, DA was used as the IS for gas chromatographic analysis for quantifi cation of the safrole level in the essential oil samples. The gas chromatographs of safrole and DA are shown in Figure 1. Figures 2 and 3 present the results of the gas chromatographic analyses of the ether-extracted Stout Camphor sample (Figure 2) and the upper and lower layers of Small-fl ower Camphor essential oil (Figure 3). DETERMINATION OF THE RRF OF SAFROLE TO DA DA was used in this study, which has a similar RT to that of safrole. To accurately quan- tify the contents of safrole in the essential oil samples, the RRF of safrole to DA had to be determined. With the RRF value, the content of safrole in each essential oil sample could be calculated according to equation (2). Figure 4 shows a plot of the peak area ratios of safrole to DA (Y axis) against the concentration ratios of safrole to DA (X axis), which demonstrates that the coeffi cient of determination (R2) for the linear regression model was 0.997 and the RRF was 1.2327 (Figure 4 and Table I). Figure 1. Gas c hromatogram of DA (IS) authentic standard. Peak 1 = DA Peak 2 = safrole.
Purchased for the exclusive use of nofirst nolast (unknown)
From: SCC Media Library & Resource Center (library.scconline.org)